ATLAS changelog
Dashboards & Widgets – Refined Configuration Workflow
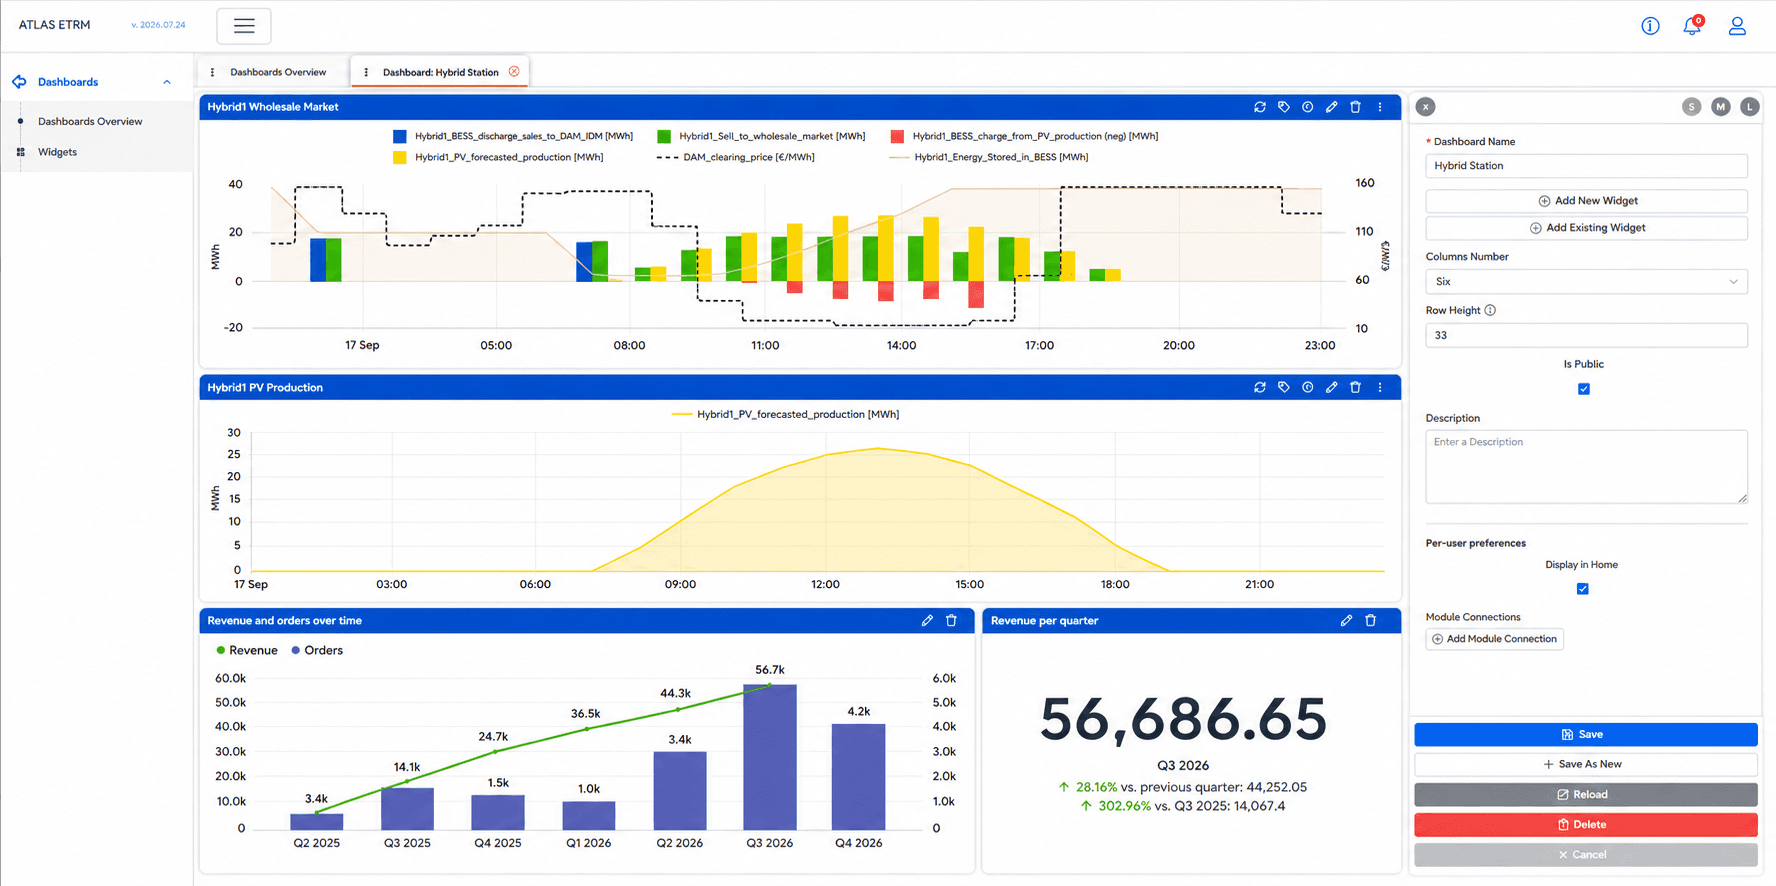
This release introduces a refreshed configuration experience for Dashboards and Widgets, making complex visualizations easier to configure and maintain.
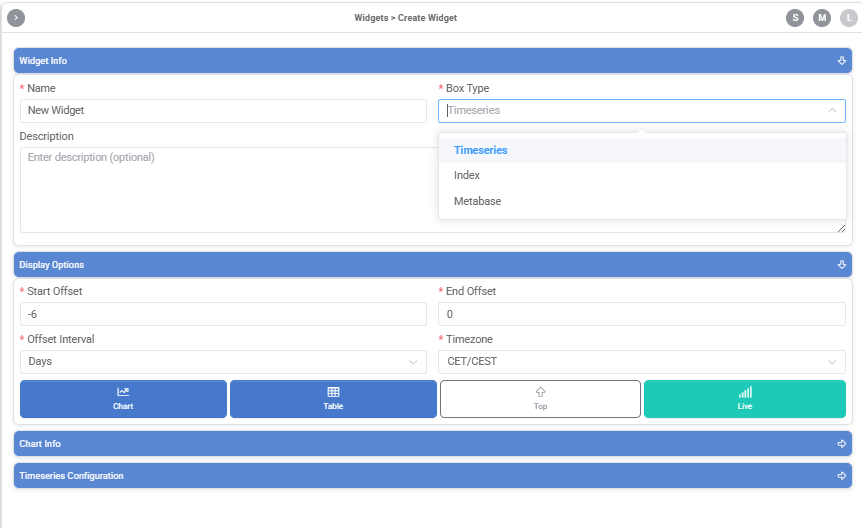
The widget editor has been reorganized into logical configuration sections that group related settings together, allowing users to move through the configuration process more naturally. Chart settings, display options, axes, stacking, and data selection are now organized into dedicated areas, while the live preview updates instantly as changes are made, allowing users to validate the final result before saving.
The dashboard editor has also been refreshed with a cleaner and more consistent layout, making it easier to organize widgets, configure dashboard properties, and build dashboards tailored to different operational and business monitoring scenarios.
Whether you're monitoring market prices, renewable generation, forecasts, portfolio exposure, settlement metrics, or other business KPIs, the updated workflow helps you configure and maintain your dashboards more efficiently while keeping the flexibility to build visualizations that match your business needs.
To explore the new workflow, navigate to Dashboards → Dashboards Overview, create a new dashboard, and configure your widgets using the redesigned editor.
Features
Battery storage configuration made easier — New setup options let you configure battery energy storage assets more quickly and with more flexibility.
Fuel cost tracking for thermal assets — Track fuel costs for thermal generation units on a daily basis, giving you more granular visibility into generation economics.
Additional declaration fields — Added the extra data fields needed for technoeconomic declarations adapting to IPTO balancing market specifications.
More market data in the Data Room — Cyprus forward market and day-ahead market data (renewable and conventional) is now available directly in the Data Room.
Dashboard version history — Dashboards now keep a history of previous versions, so you can review how a view has changed over time.
Audit trail for formulas and templates — Changes to formulas and templates are now tracked, giving you full visibility into who changed what and when.
Tagging support for data uploads — Time series upload templates now support tags, making it easier to organize and find your data.
Improvements
Save default views for grid queries — Set a default view when building a grid query, so your preferred layout is ready every time.
Smarter custom field requirements — Custom fields are now required only when relevant, reducing unnecessary data entry.
Further Cashflow page refinements — Continued usability refinements to the Cashflow page following the recent redesign.
Quicker data retrieval — Time series and Data Room queries now return results faster, especially for large data sets.
Fixes
Fixed Math Editor template comment behaviour so saved comments carry over correctly when a template is reused.
Fixed Math Editor search responsiveness while typing formulas.
Fixed cleared energy volume calculations for non-quarter-hourly XBID contracts.
Fixed Deal Template copying so price fields remain intact on the original template.
Fixed Deal duplication so class options are retained.
Fixed Deal ID assignment during deal limit validation.
Fixed Asset search filtering in Deals for more accurate results.
Fixed PnL report downloads within deals.
Fixed time series ordering in Deals for synthetic profiles.
Fixed Asset data synchronization in Math Editor when saving asset updates.