2.2 Widgets
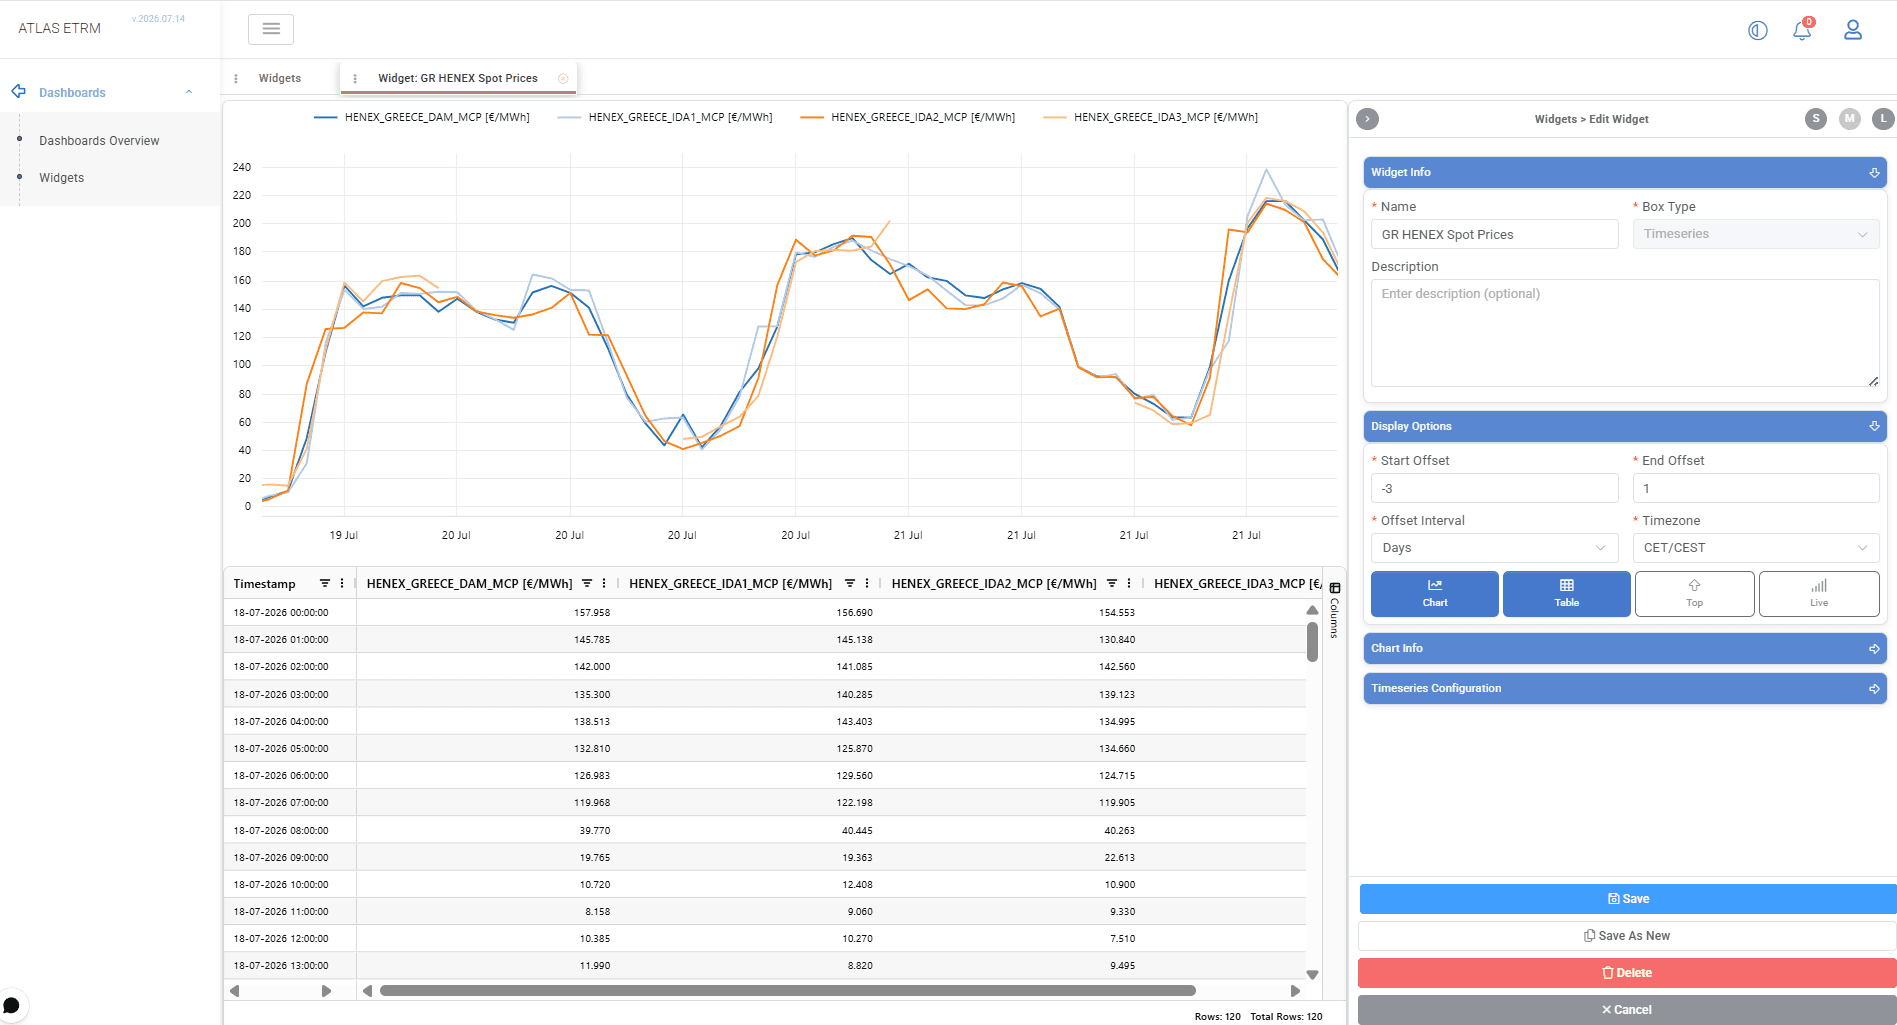
Overview
Widgets are the reusable visualization components of ATLAS Dashboards, providing a flexible way to visualize and monitor data, key indexes and Business Intelligence reports.
Each widget represents an independent reporting component that defines what information is displayed and how it is presented. Once created, a widget can be reused across multiple dashboards, allowing the same visualization to be shared without duplicating its configuration.
Depending on the selected Box Type, different configuration options become available. ATLAS currently supports the following widget types:
Timeseries – Displays one or more timeseries as charts and/or tables.
Index – Displays one or more calculated indexes over configurable time periods.
Metabase – Embeds an existing widget from the integrated Metabase BI platform.
Widgets can be created, edited, duplicated and deleted independently of dashboards, making it easy to maintain consistent reporting across the platform.
Creating a Widget
A new widget can be created by selecting the + button in the Widgets tab.
The first step is to complete the Widget Info section by providing the widget name, selecting the appropriate Box Type, and optionally entering a description.
The remaining configuration depends on the selected widget type.
Creating a Timeseries Widget
Timeseries widgets are used to display one or more timeseries retrieved from the ATLAS Data Room.
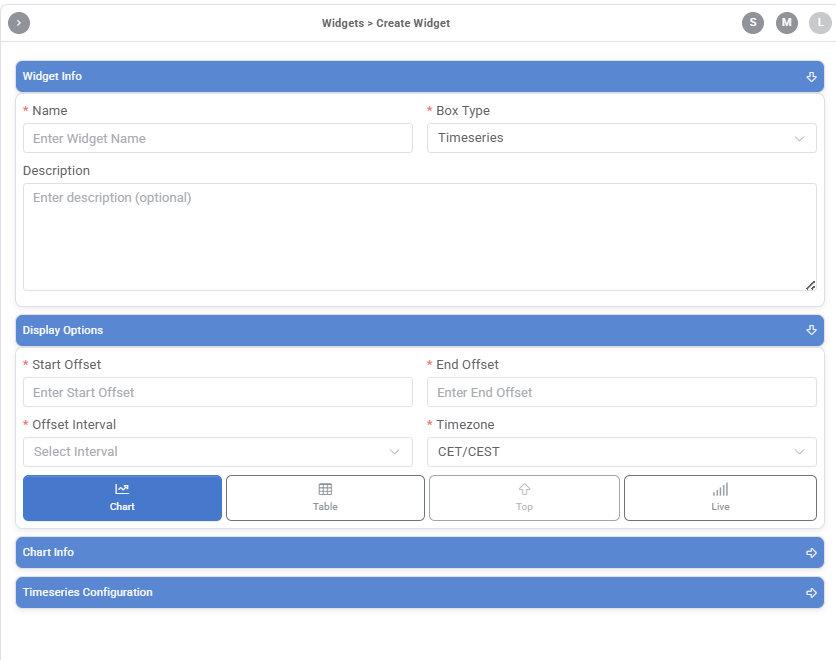
Their configuration consists of three logical sections:
Display Options
The Display Options section defines the time period displayed by the widget.
Instead of absolute dates, widgets use relative offsets. Users specify a Start Offset, End Offset, Offset Interval, and Timezone, allowing the widget to automatically display the appropriate time window whenever it is opened.
The remaining options control how the widget behaves and how the data is presented. Users can enable Show Chart, Show Table, choose whether the Table is displayed above the chart, and optionally enable Live mode to continuously refresh the displayed data.
Example
If the user sets:
Start Offset: -3
End Offset: 1
Offset Interval: Hours
Timezone: UTC
the widget displays data in UTC, showing values from the previous 3 hours and the next 1 hour (if available in the selected timeseries).
Chart Configuration
The Chart Info section controls how the data is visualized.
Users can configure one or more X and Y axes, define their titles and positions, enable or disable grid lines, and create optional stack groups for cumulative visualizations. Multiple axes allow datasets with different units or scales to be displayed within the same chart.
These settings affect only the chart presentation and do not modify the underlying timeseries.
Timeseries Configuration
The Timeseries Configuration section defines the datasets displayed by the widget.
Users can search for one or more timeseries and configure the appearance of each one independently, including its colour, line type, point type and assigned axes.
Multiple timeseries can be displayed within the same widget for comparison. When required, they can also be grouped into stack groups to produce cumulative visualizations.
After the configuration is complete, selecting Preview generates the chart using the current settings before the widget is saved.
Creating an Index Widget
An Index Widget presents calculated values for a selected period, allowing key indicators to be monitored directly from a dashboard.
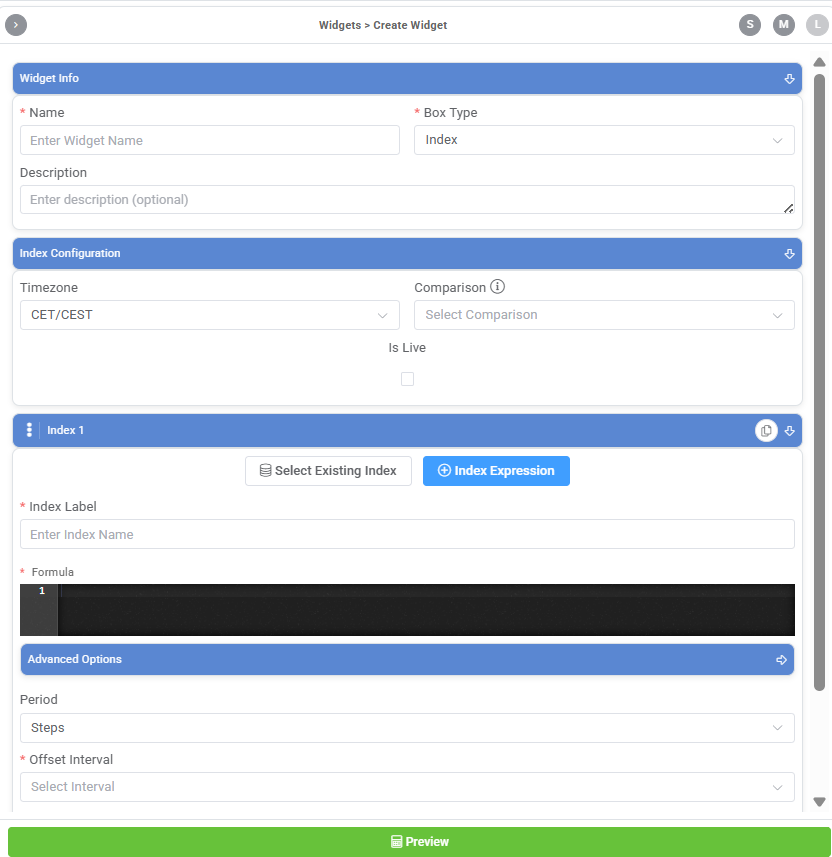
The calculation can be defined directly through Index Expression or based on an index already available in Data Room → Indexes. When an existing index is used, its configuration is displayed in the widget for review.
The Index Label defines the name under which the calculated value is displayed in the widget.
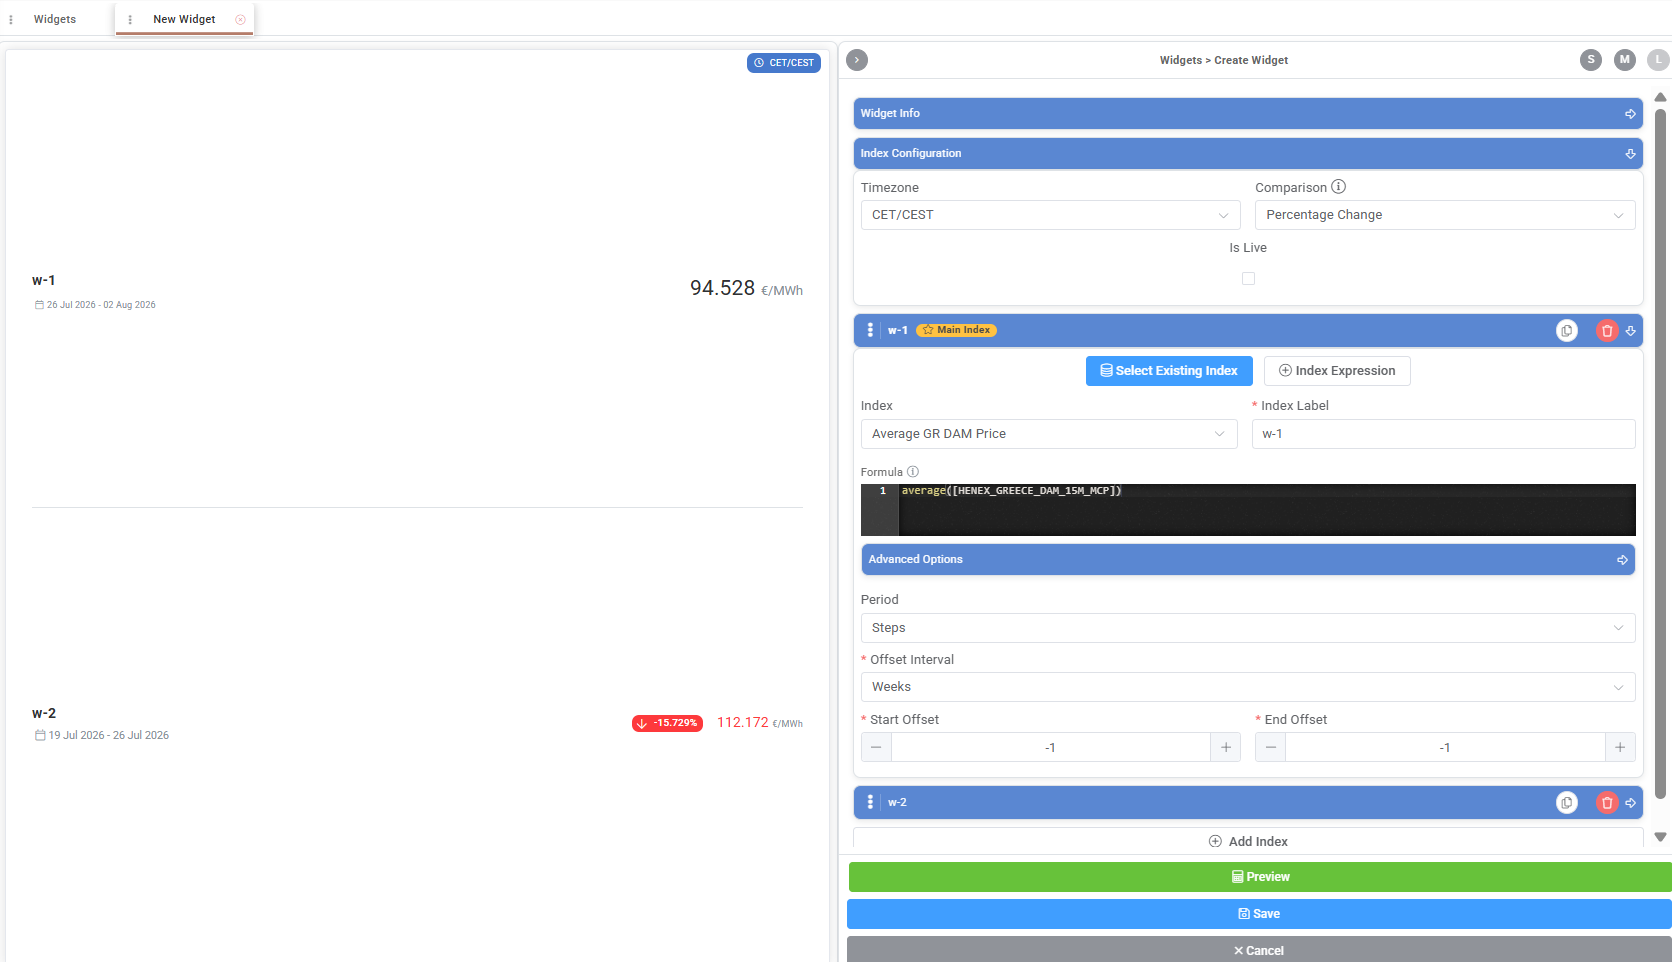
This label is independent of the underlying index name, allowing the same calculation to be presented multiple times. For example to compare the same index for different weekly periods, you can use labels named W-1, W-2 and W-3.
The calculation period may be defined through a fixed date range or relative offsets. Additional information, including the description, UOM and displayed decimal places, is available under Advanced Options.
Selecting Add Index adds another index configuration to the widget. Existing configurations can also be copied when the same calculation is required with a different period, offset or label.
When multiple indexes are included, one can be designated as the Main Index. The optional Comparison setting defines how the other results are evaluated against the Main Index. Depending on the selected method, the widget can display their difference, ratio, percentage or percentage change. If no comparison is selected, each index is displayed independently.
For more information and example workflows, see Data Room - Indexes.
Creating a Metabase Widget
Metabase widgets embed reports (Questions) from the integrated Metabase Business Intelligence platform.
To create a Metabase widget, the user provides the widget information and selects one of the available options from the drop-down list. Only Questions that have been published in Metabase are available for selection in ATLAS. For instructions on publishing Questions, refer to the Publishing Metabase Content section.
Once saved, the widget can be added to one or more ATLAS dashboards in the same way as any native widget.
Editing and Deleting Widgets
Widgets can be modified at any time by double-clicking them in the grid or by selecting the Edit action (pencil icon).
When a widget is opened in edit mode, any configuration changes are immediately reflected in the preview area, allowing users to validate the visualization before saving. The preview also supports zooming using the mouse wheel for closer inspection of the displayed data.
After making the required changes, users can select Save to update the existing widget or Save As New to create a new widget while preserving the original configuration.
Widgets that are no longer required can be deleted by selecting the Delete action (trash can icon) from the widget grid, by right-clicking the widget and selecting Delete Widget, or by opening the widget in edit mode and selecting Delete. A confirmation message is displayed before the widget is permanently removed.
Appendix – Field Details
Widget Properties
Field / Element | Required | Description |
|---|---|---|
Widget Name | Yes | Name of the widget. |
Box Type | Yes | Widget type. Options: Timeseries, Index, Metabase. |
Description | No | Optional description of the widget. |
Timeseries Display Options
Field / Element | Required | Description |
|---|---|---|
Start Offset | Yes | Number of intervals displayed before the current time. Negative values represent past periods. |
End Offset | Yes | Number of intervals displayed after the current time. Positive values represent future periods. A value of 0 represents the current date/time. |
Offset Interval | Yes | Time unit used by the Start Offset and End Offset values. Options: Minutes, 5 Minutes, 10 Minutes, Quarter Hour, Half Hour, Hours, Days, Weeks, Months, Quarters, Years. |
Timezone | Yes | Timezone used to display the data. Options: UTC, CET/CEST, EET/EEST, GAS. |
Show Chart | Yes* | Enables chart visualization. |
Show Table | Yes* | Enables table visualization. |
Table on Top | No | Displays the table above the chart when both views are enabled. |
Live | No | Automatically refreshes the widget with the latest available data. |
* At least one of Show Chart or Show Table must be enabled.
Chart Configuration
Field / Element | Required | Description |
|---|---|---|
X Axis Title | No | Title displayed on the X axis. |
X Axis Position | No | Position of the X axis. Options: Top, Bottom. |
Show Lines | No | Displays grid lines for the selected axis. |
Y Axis Title | No | Title displayed on the Y axis. |
Y Axis Position | No | Position of the Y axis. Options: Left, Right. |
Auto Create | No | Automatically creates a Y axis for the selected timeseries. |
Add X Axis | No | Adds an additional X axis. |
Add Y Axis | No | Adds an additional Y axis. |
Add Stack | No | Creates a new stack for grouped timeseries. |
Group | No | Defines the name of the stack group. |
Timeseries Configuration
Field / Element | Required | Description |
|---|---|---|
Timeseries | Yes | Timeseries displayed by the widget. |
Colour | No | Display colour of the timeseries. |
Line Type | No | Visualization style. Options: Line, Dash Line, Bar, Scatter, Line Step, Dash Line Step. |
Point Type | No | Marker style. Options: None, Circle, Cross, Triangle, Diamond, Plus, Pin, Square. |
X Axis | No | X axis assigned to the timeseries. |
Y Axis | No | Y axis assigned to the timeseries. |
Is Stacked | No | Includes the timeseries in a stack. |
Add Timeseries | No | Adds another timeseries to the widget. |
Index Configuration
Field / Element | Required | Description |
|---|---|---|
Timezone | Yes | Timezone used to display the index. Options: UTC, CET/CEST, EET/EEST, GAS. |
Live | No | Automatically refreshes the widget with the latest available values. |
Comparison | No | Comparison method. Options: Difference, Ratio, Percentage, Percentage Change. |
Index | Yes | Index displayed by the widget. |
Period | Yes | Period definition method. Options: Date Range, Steps. |
Date Range | Yes | Defines the start and end dates of the displayed period. Available when Period is set to Date Range. |
Offset Interval | Yes | Time unit used by the Start Offset and End Offset values. Options: Minutes, 5 Minutes, 10 Minutes, Quarter Hour, Half Hour, Hours, Days, Weeks, Months, Quarters, Years. Available when Period is set to Steps. |
Start Offset | Yes | Number of intervals displayed before the current time. Available when Period is set to Steps. |
End Offset | Yes | Number of intervals displayed after the current time. Available when Period is set to Steps. |
Add Index | No | Adds another index to the widget. |
Metabase Widget Configuration
Field / Element | Required | Description |
|---|---|---|
Select Metabase Dashboard | Yes | Drop-down list with published Metabase dashboards available for embedding. |
Was this helpful?