3.3 Indexes
Overview
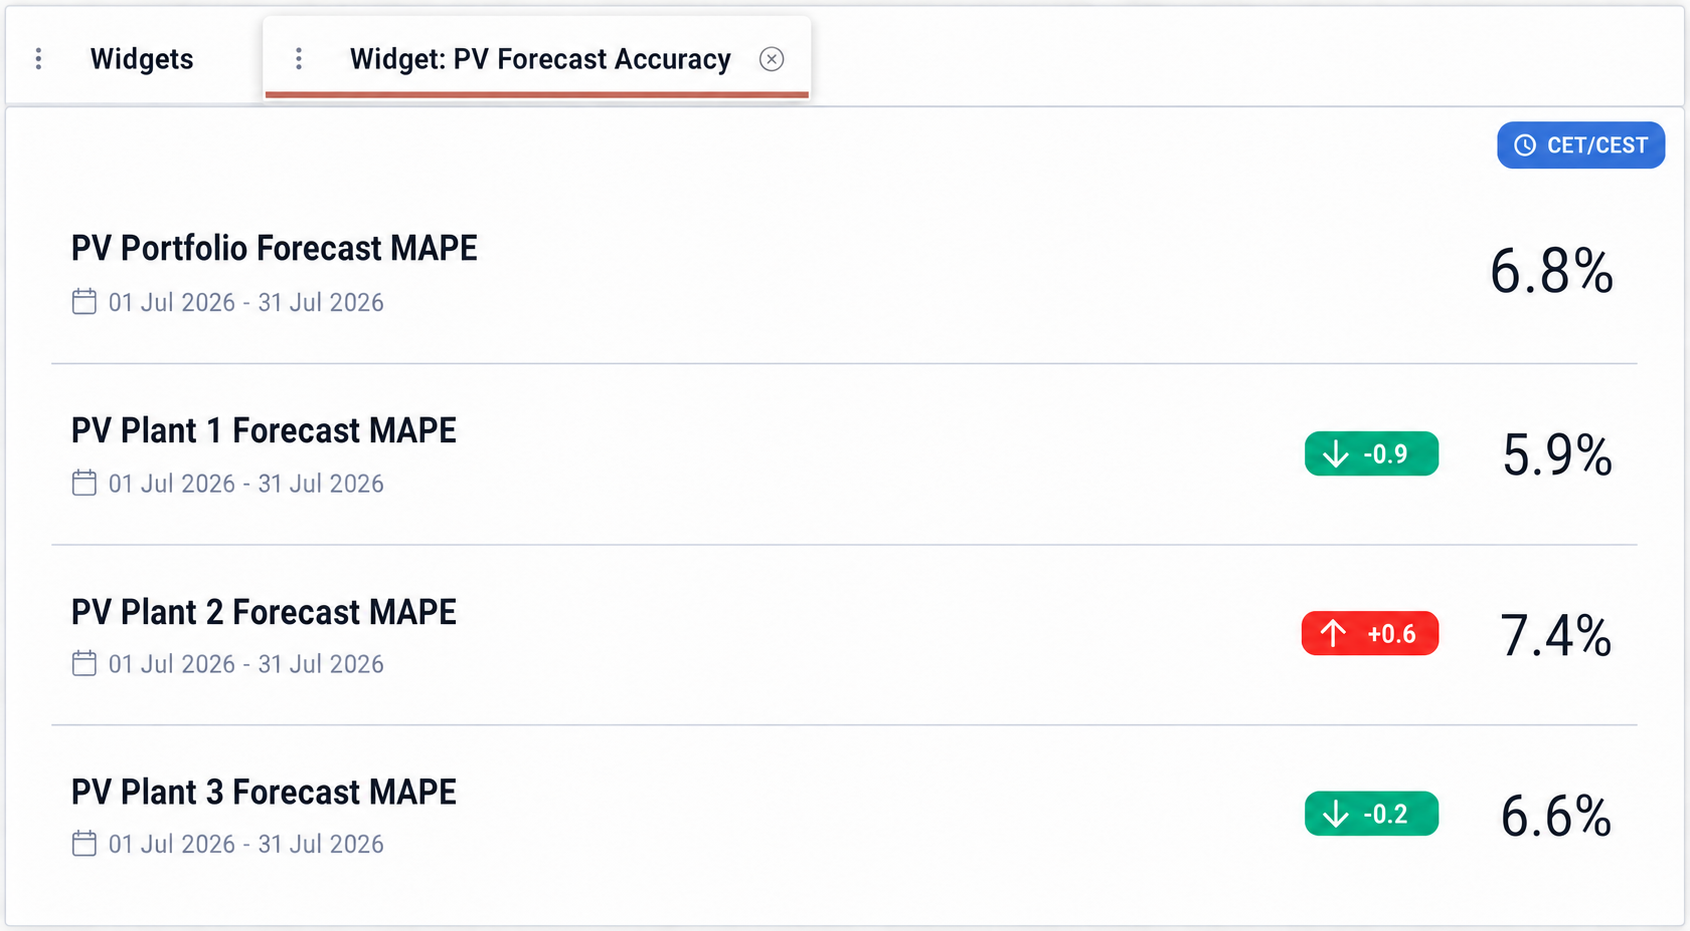
Indexes allow users to turn detailed time-series data into concise indicators that support faster monitoring and decision-making. Instead of reviewing all individual values within a period, users can calculate metrics such as average market prices, price spreads, percentage changes, demand ranges, or forecast accuracy. These indicators can be used to track performance, identify market differences, and highlight changes in operational or commercial conditions.
Each index is defined through a formula that follows the same expression syntax as the Math Editor and may reference existing data series, mathematical operators, and system functions. Unlike Math Editor calculations, which can generate complete time series, an index returns a single numeric value for the selected period.
Once created, indexes can be displayed through Index Widgets. The same index can be evaluated over different periods to monitor changes over time, while multiple indexes can be presented together to compare markets, portfolios, assets, or other datasets directly from a dashboard.
Indexes can also be created directly while configuring an Index Widget. For further details, see Creating an Index Widget.
All saved indexes are available in the main grid, together with their description, formula, Unit of Measurement (UoM), decimals, and any associated Widget IDs. From this grid, users can create new indexes, edit or delete existing ones, and export the displayed records.
Creating an Index
To create an index, select the Add (+) icon from the main grid. In the new tab, enter a descriptive name and, where useful, provide additional information about the purpose of the calculation.
Select the appropriate UoM and define the number of decimal places used to display the result. Enter the calculation in the Formula editor, referencing data series inside square brackets and combining them with mathematical operators and supported functions.
Note: Index formulas must use functions that return a scalar numeric output as the final outcome. The supported functions are listed in Appendix II, with practical examples provided below.
For example, the following index calculates the average Greek DAM price:
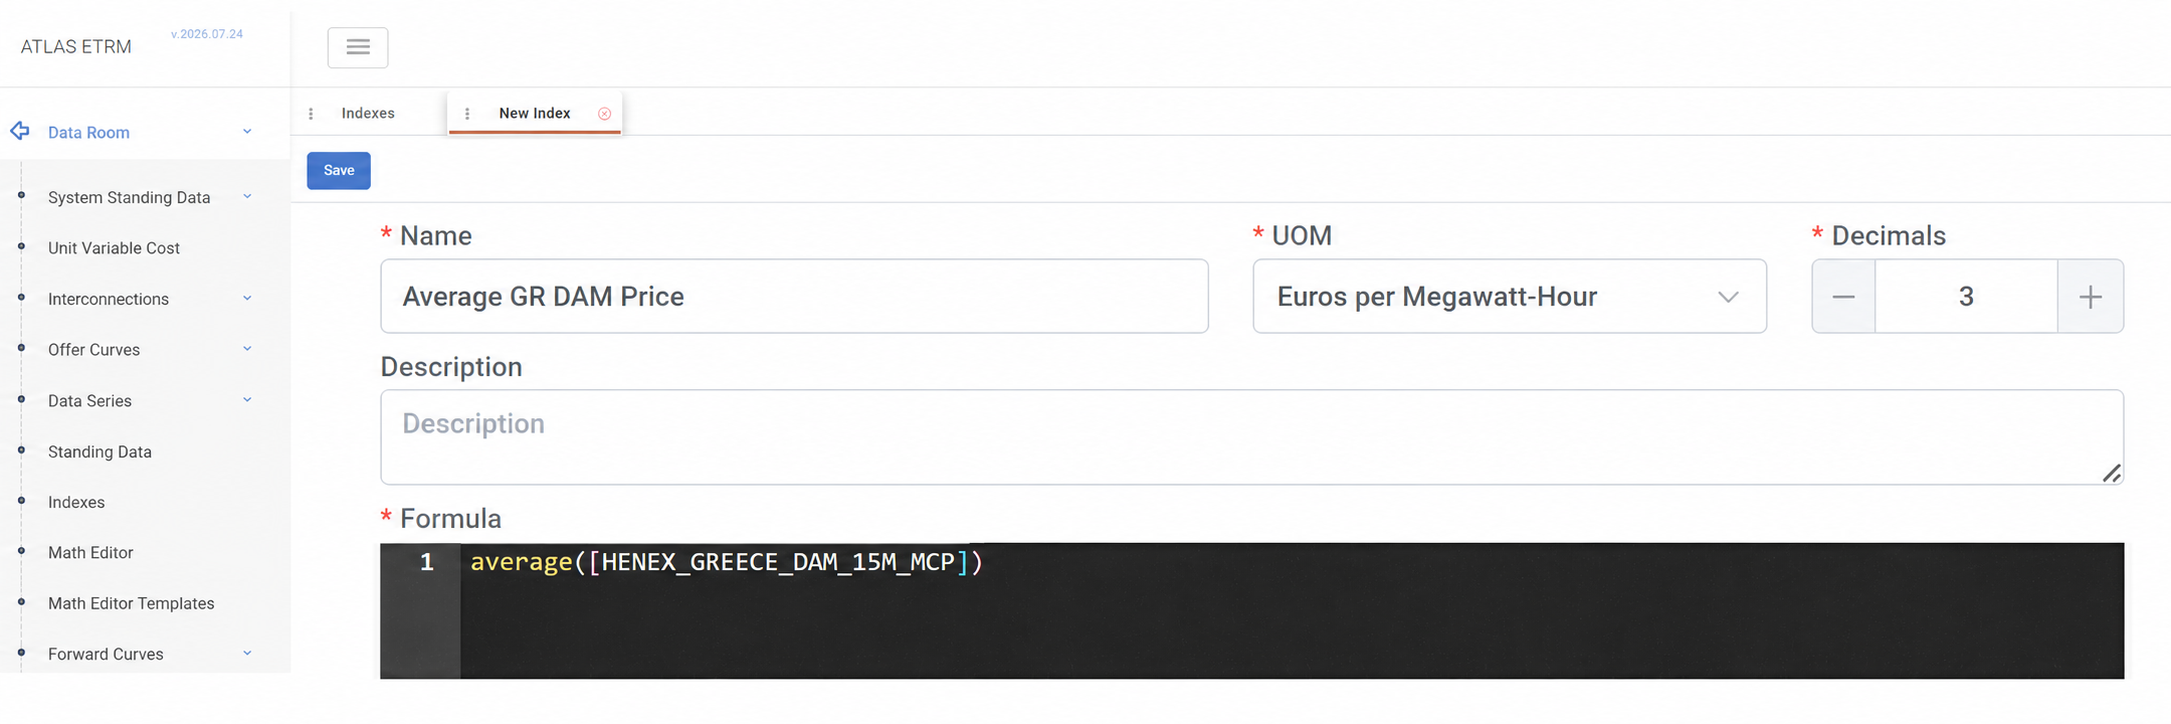
Select Save to create the index and make it available for use in Index Widgets.
Using Indexes in Widgets
Saved indexes can be selected when configuring an Index Widget. Users can add the same index multiple times with different calculation periods or include different indexes within the same widget.
One entry is designated as the Main Index, and the selected comparison method determines how the remaining results are compared against it. The calculation period can be defined either through a specific Date Range or as a relative time window using the Offset Interval, Start Offset, and End Offset settings.
Example Workflows
Comparing the Average Greek DAM Price Across Weeks
As shown above, the Average GR DAM Price index is created in Data Room → Indexes using the following formula:
AVERAGE([HENEX_GREECE_DAM_15M_MCP])The calculation period is defined later, when the index is added to an Index Widget.
After the index has been created, an Index Widget can be configured through Dashboards → Widgets.
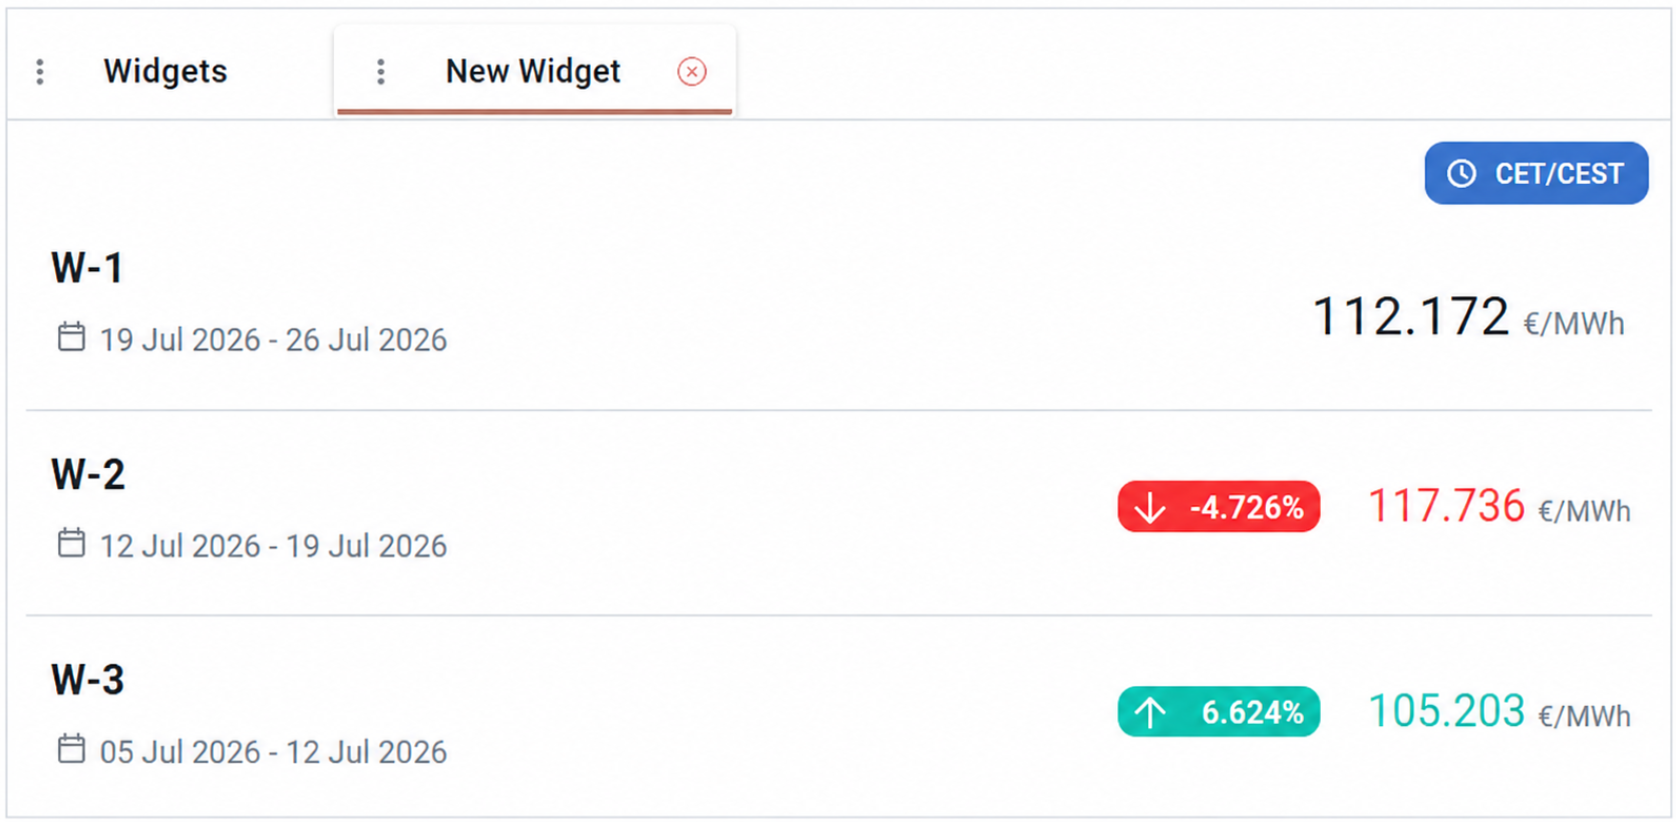
The same index can be added multiple times to the widget using different weekly offsets. For example, offsets of -1, -2, and -3 calculate the average price for each of the three previous weeks.
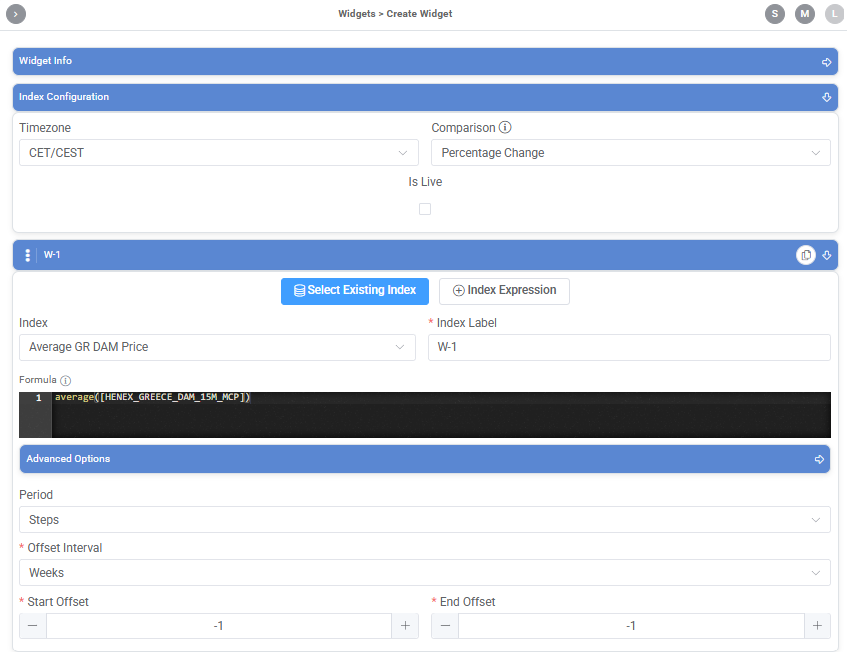
Although all entries reference the same index, the editable Index Label allows them to be displayed as W-1, W-2, and W-3. One period is designated as the Main Index, while Percentage Change is used to display the relative increase or decrease compared with the other periods.
Comparing European DAM Prices
Separate indexes are created in Data Room → Indexes to calculate the average DAM price for Greece, Romania, and Bulgaria using the following formulas:
AVERAGE([ENTSOE_GR_DAM_Price_15M])
AVERAGE([ENTSOE_RO_DAM_Price_15M])
AVERAGE([ENTSOE_BG_DAM_Price_15M])
The indexes can be added to the same widget, with one market designated as the Main Index. Difference as the comparison method is used to calculate and display the DAM price spread between the Main Index and each of the other markets for the configured period.
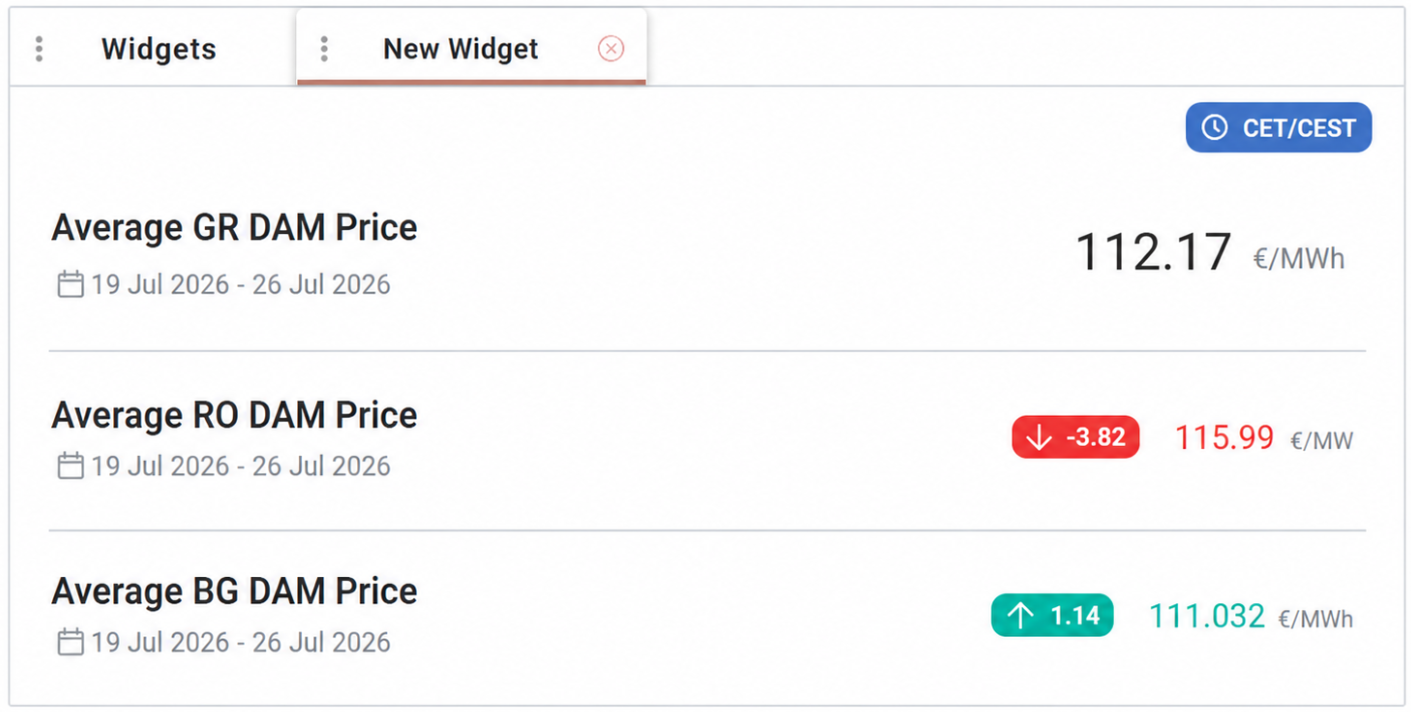
Alternatively, the calculations can be defined directly within the Index Widget. In Dashboards → Widgets, create a new Index Widget. The Index Expression option is selected by default, allowing users to enter each market’s formula and configure its Index Name, UoM, decimals, and calculation period directly within the widget.
Monitoring the Actual Load Range
An index created in Data Room → Indexes calculates the difference between the maximum and minimum actual load in Greece:
MAX([ENTSOE_Actual_Load_GR]) - MIN([ENTSOE_Actual_Load_GR])The result, expressed in MW, represents the actual load range within the configured period. A higher value indicates greater variation between peak and minimum demand, while a lower value indicates a more stable load profile.
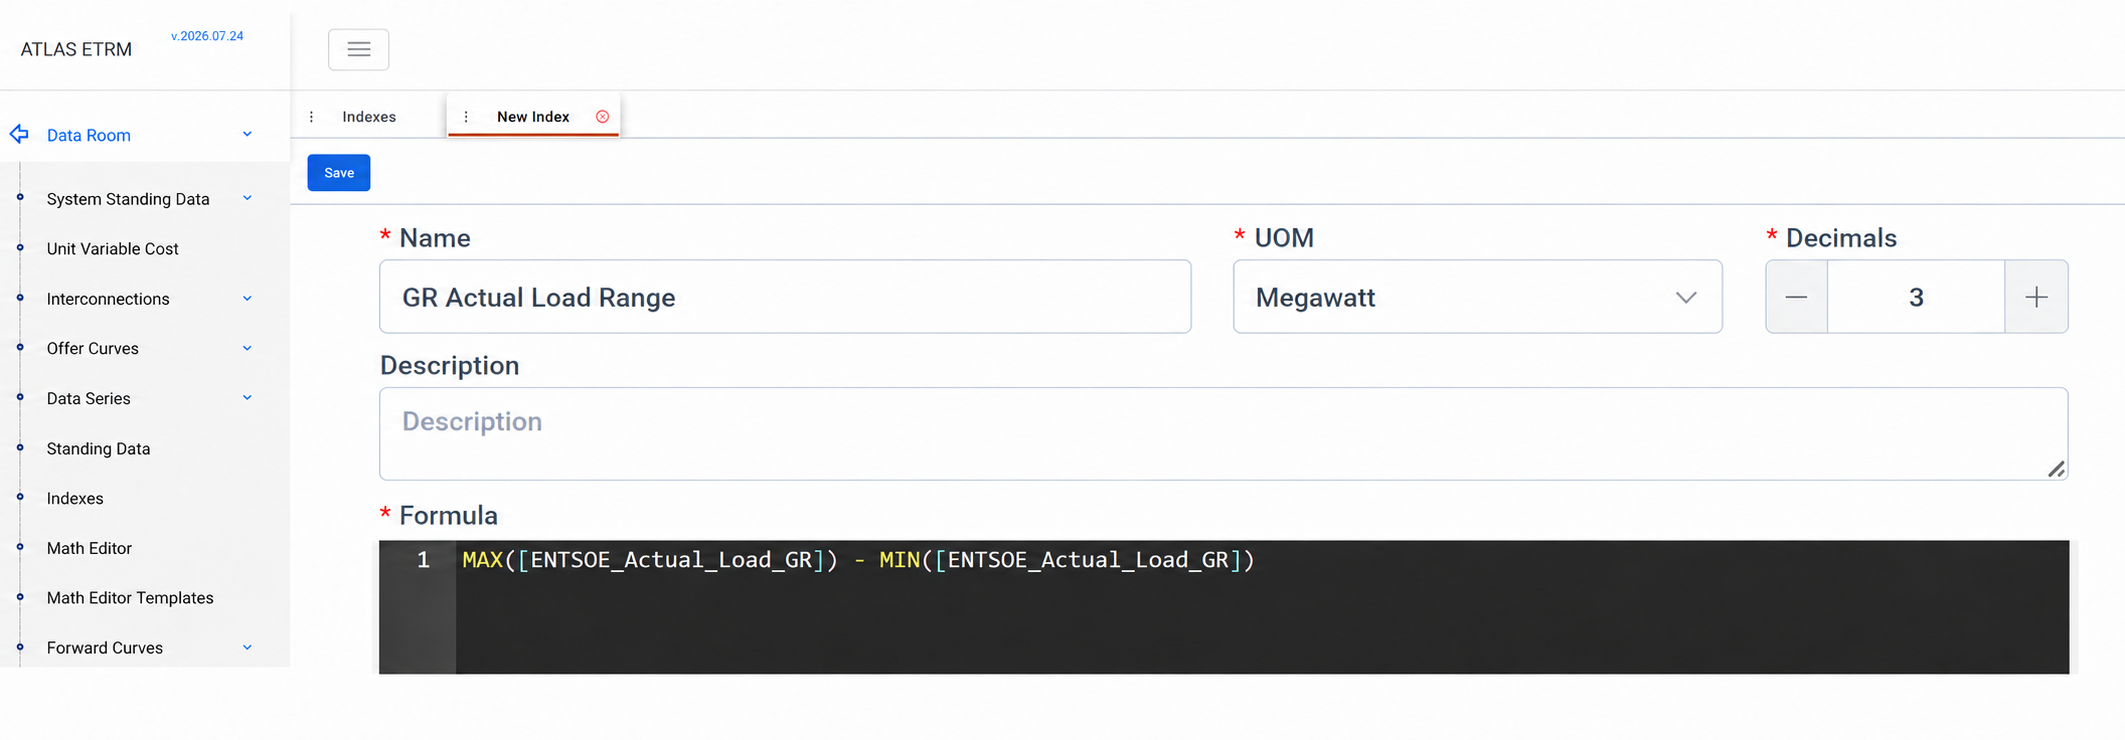
When added to an Index Widget, the calculation can be applied to different daily, weekly, or monthly periods. The same index can also be added multiple times with different offsets to compare how load variability changes over time.
Evaluating Load Forecast Accuracy
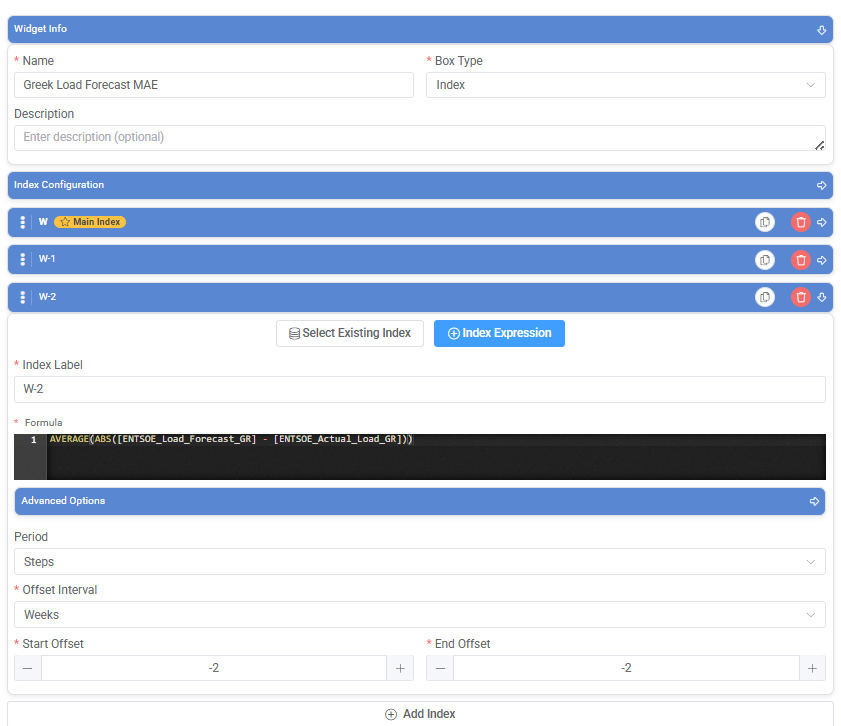
An index created in Data Room → Indexes calculates the Mean Absolute Error (MAE) between the forecast and actual load in Greece:
AVERAGE(ABS([ENTSOE_Load_Forecast_GR] - [ENTSOE_Actual_Load_GR]))The result, expressed in MW, represents the average absolute difference between the forecast and actual load values within the configured period. A lower MAE indicates greater forecast accuracy.
Alternatively, the MAE calculation can be created directly within an Index Widget by entering the formula and configuring the required calculation period.
Use the copy icon to duplicate the index configuration, and then adjust only the label and calculation period to compare the MAE across different periods.
Other Use Cases
DAM–Imbalance Price Spread: Calculate the difference between the Day-Ahead Market price and the imbalance price for each settlement period. This supports the analysis of price relationships and market conditions across different periods.
Total Trades by Technology: Combine market time series to calculate the total traded volume by technology, such as RES or supply, providing an aggregated view of trading activity in the market.
Total Imports/Exports: Calculate the total imported or exported volume per day or week and compare the results across different periods.
Appendix I - Field Details
Field / Element | Required | Description |
|---|---|---|
Name | Yes | Descriptive name used to identify the index. |
Description | No | Additional information about the purpose or calculation logic of the index. |
UoM | Yes | Unit of measurement applied to the calculated result. Selected from the predefined UOM list. |
Decimals | Yes | Number of decimal places used to display the index result. |
Formula | Yes | Expression used to calculate the index. It may reference existing data series, mathematical operators, and supported functions that return a scalar numeric output. For further details, see Math Editor Functions. |
Widget ID | No | Identifier of a widget using the index, where applicable. |
Appendix II – Scalar Numeric Functions
The following Math Editor functions can return a scalar numeric output and can therefore be used to produce the final result of an Index formula:
average,averageif,averagetimemax,maxif,maxtimemin,minif,mintimesum,sumifcountifprioritynotnull
Some functions may return different output types depending on the selected option and input type. For further details, see Math Editor Functions