3.4 Collection
Overview of Collections
The user can create a collection of data series, namely a combination/basket of different data series, through the Available Data Series menu.
Any time the user presses the "+" button on the left-hand side of each data series, this data series is added to the current collection. As shown in the image below, three data series were added at the current collection containing information for "ADMIE Weekly load forecast from D-1 to D-7". Each time data series added in collection a counter at the top of the grid increases ("View Selected Timeseries") and shows the current number of selections.
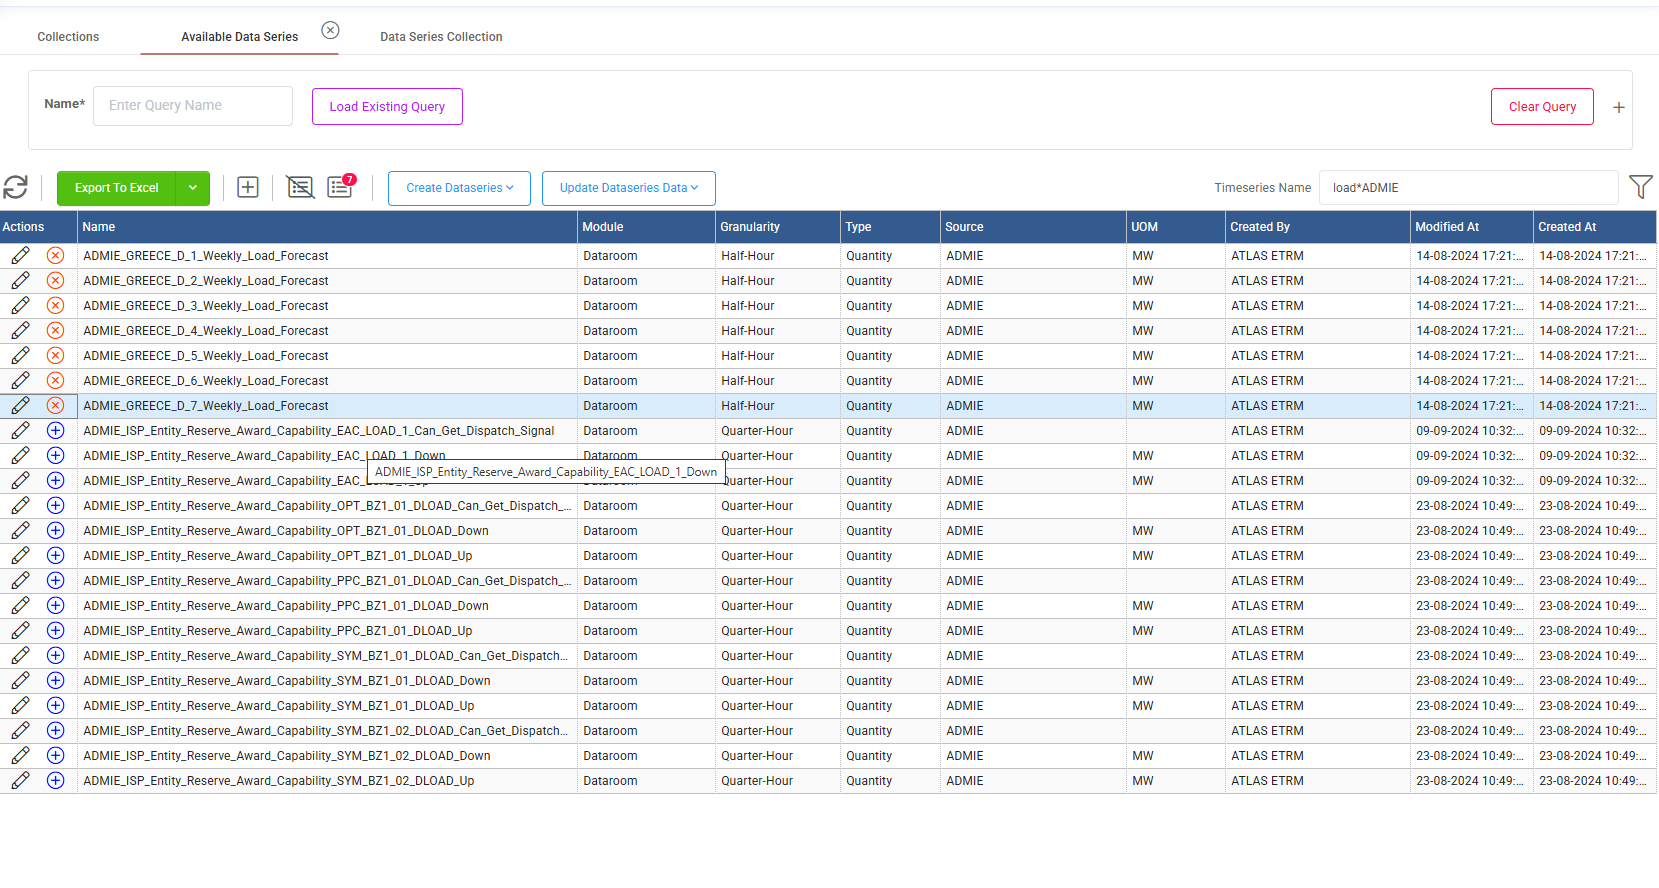
When the icon is pressed user is navigated to the specific draft collection. You will notice that after pressing the "+" icon it turns to an "x" one, that you can use to remove the specific timeserie from your draft collection.
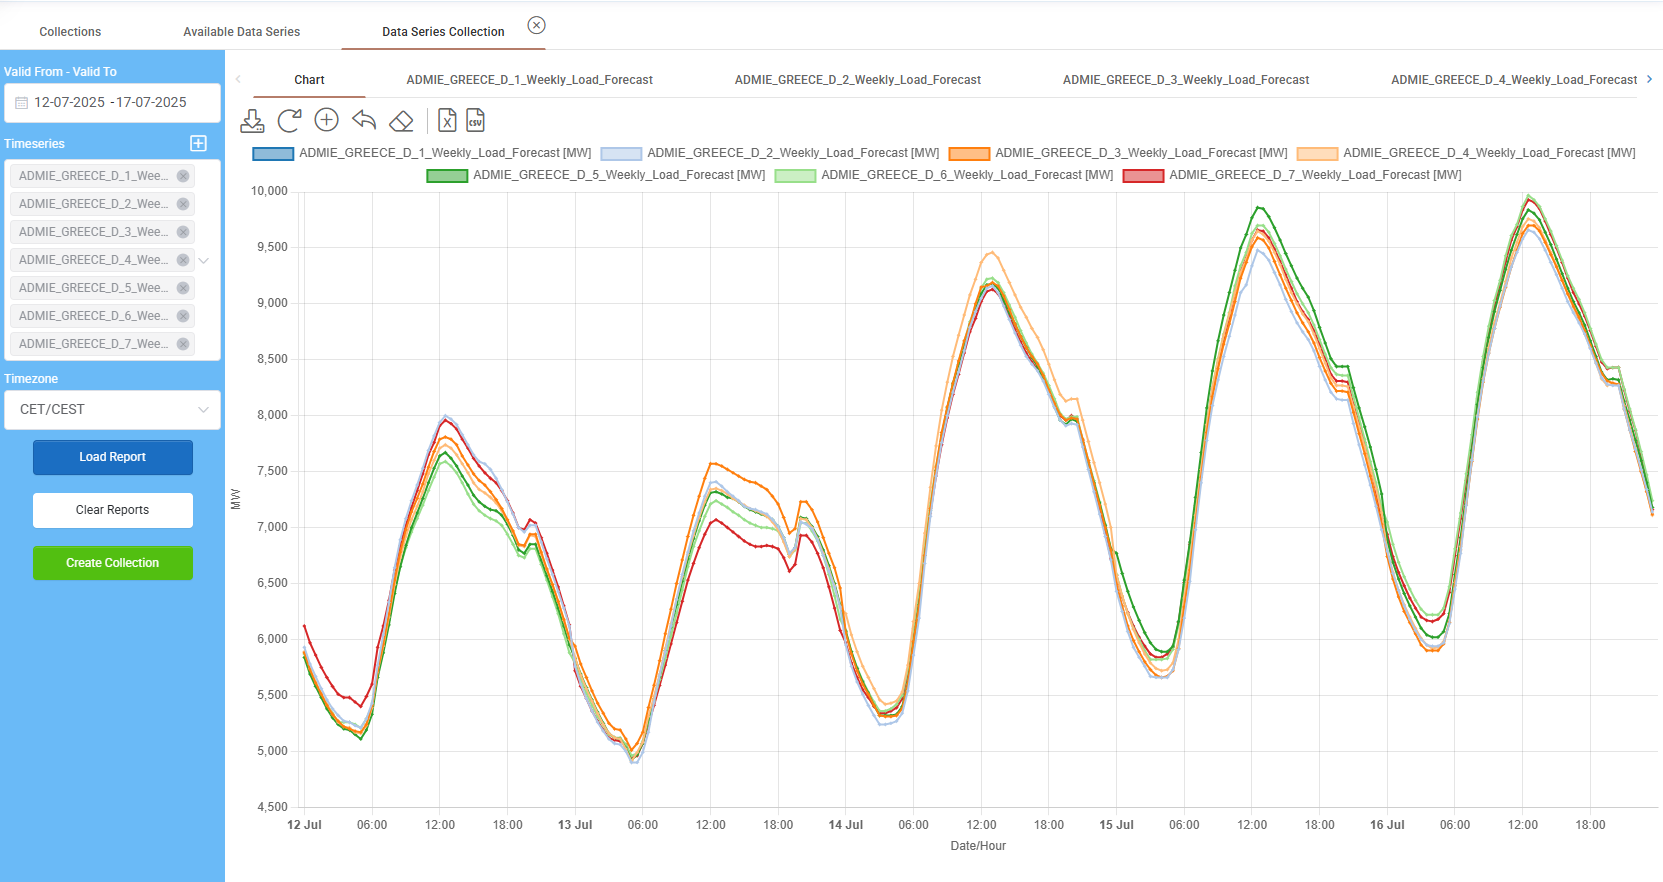
There are options for date range, the Timeseries depicted in the chart (with the small "x" next to timeseries name you can delete timeseries from your collection) and time zone. Below there are three buttons.
One for loading the report - chart.
One for clearing the report - chart.
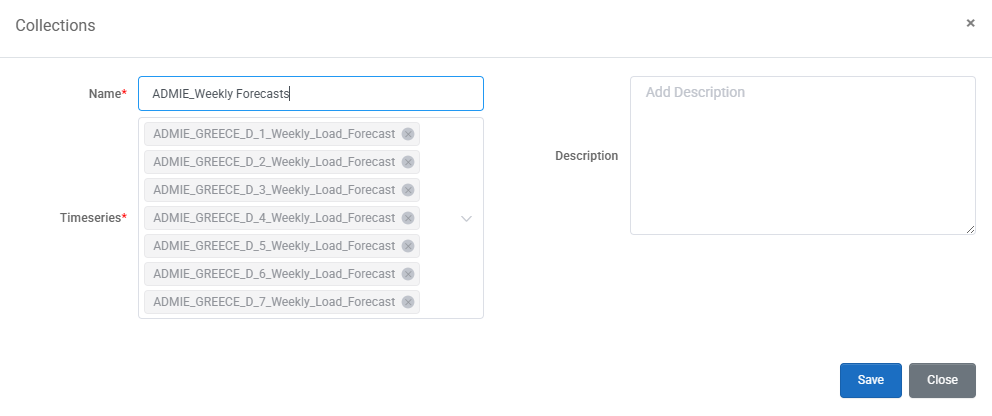
And the last is to create the collection. When user presses the create collection a new pop-up window appears that prompts you to provide a name for you collection, showing the relevant timeseries that will be included and optionally you can provide a description, for easier memo. By clicking save your collection is stored in the system.
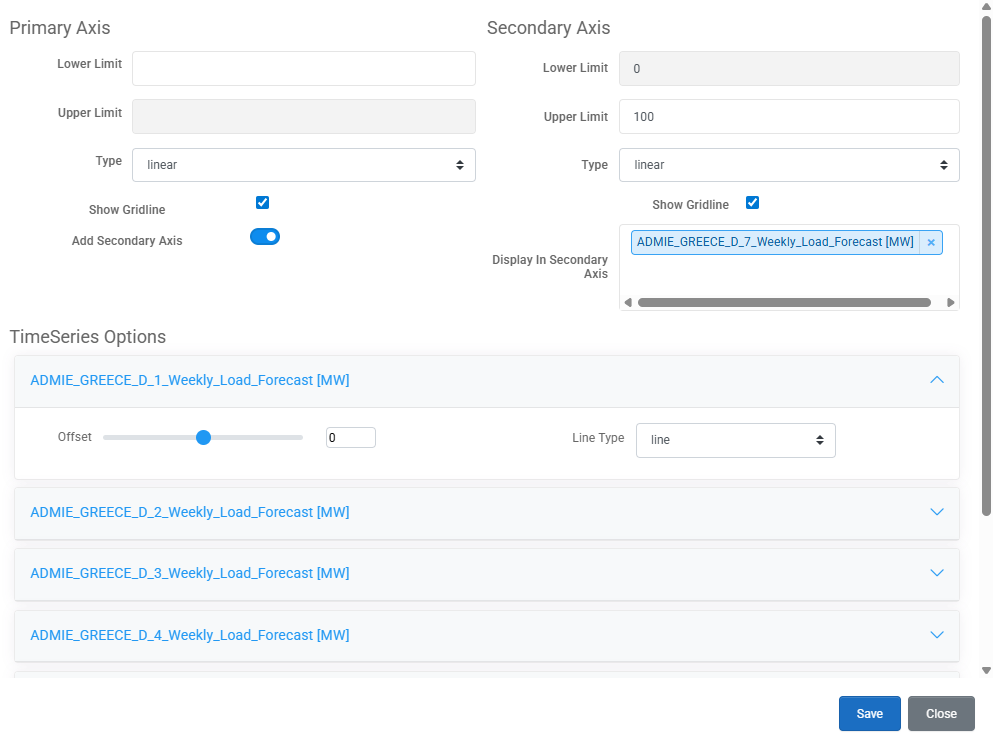
An important feature is that users can edit the diagram of the collection, in terms of axes limits, adding a secondary axis or changing the type of chart from "+" button (change limits) on the top of the chart. You can even customize the offset for each one of the data series in the collection and specify the line type (line, bar, scatter). By clicking "Save" your preferences are stored.
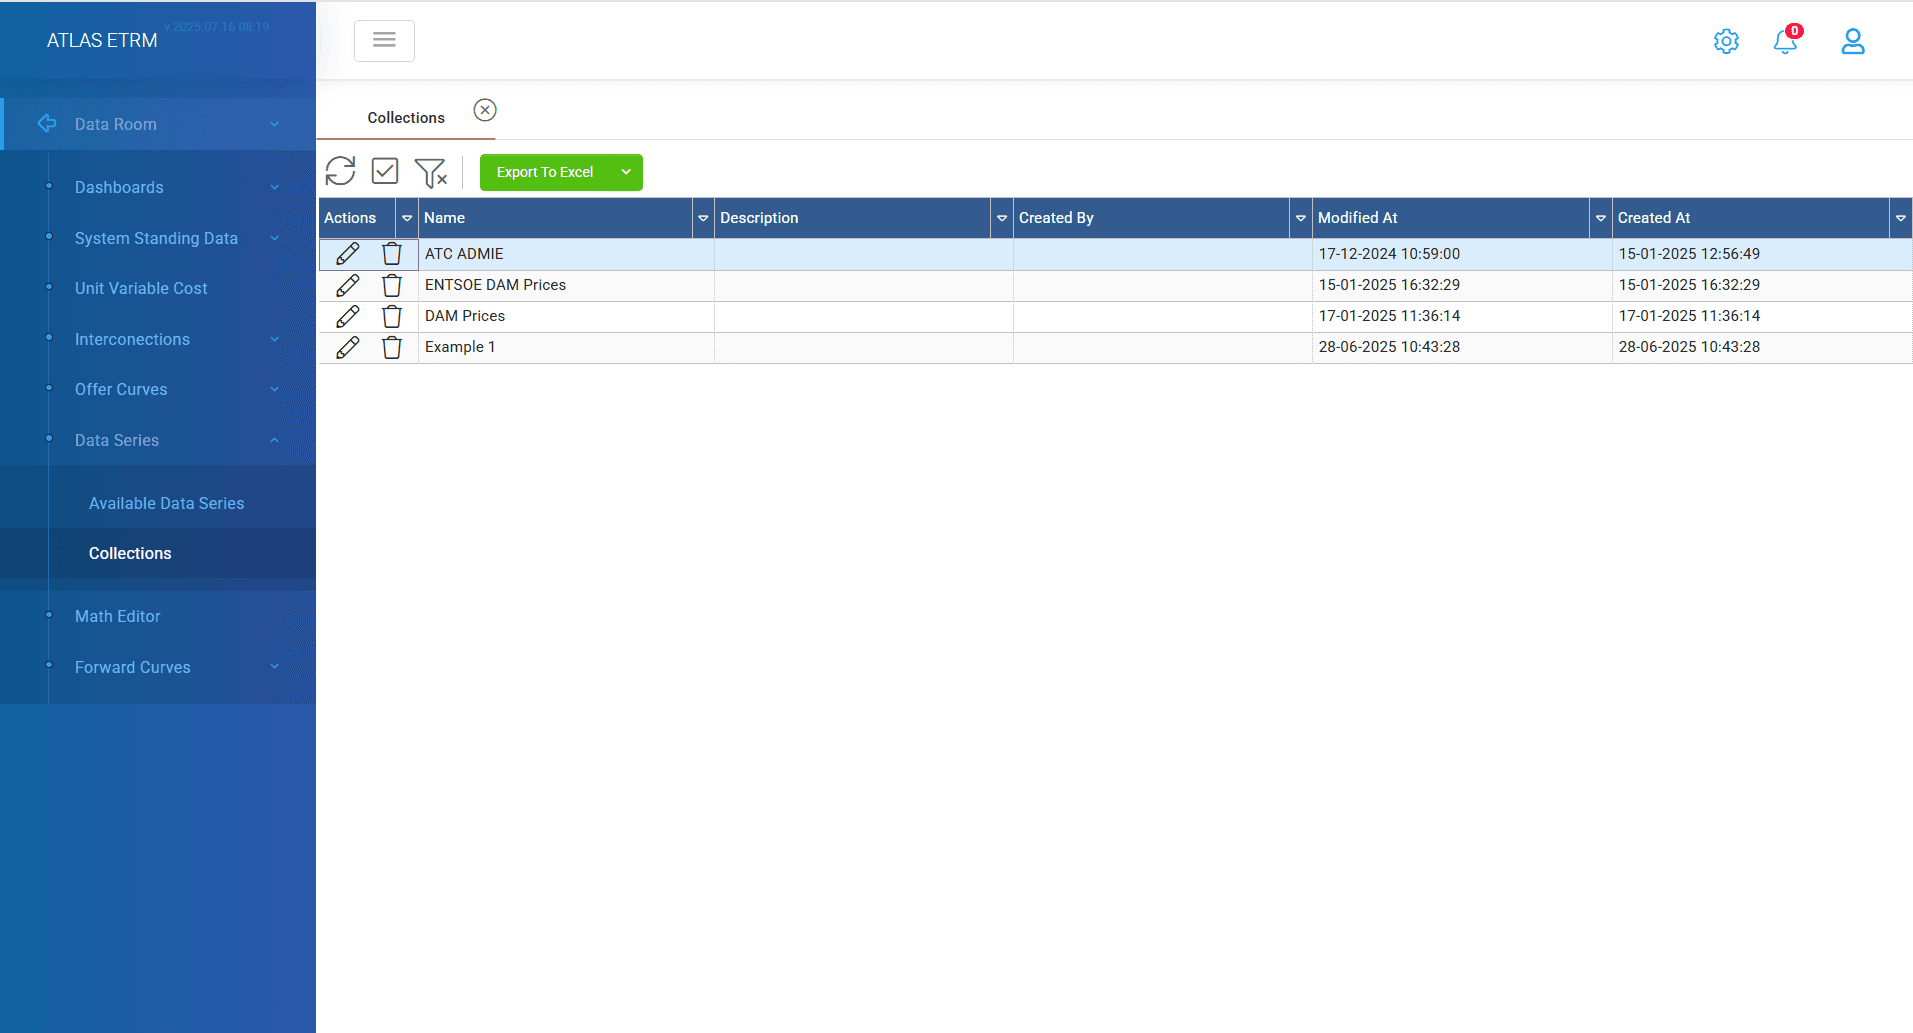
After the successful creation of the collection user will be able to view it easily from "Collections" tab by double clicking on the collection. Of course, you can easily edit and delete the collection from the buttons in actions column.
Another important feature is that when you are inside a collection you can hide one or more data series from the chart by clicking on top of grid the name of the data series you want to temporally remove from chart to focus on the other ones. Next to chart tab the other tabs show in table form the data of each one data series inside the collection, which can be modified as well.
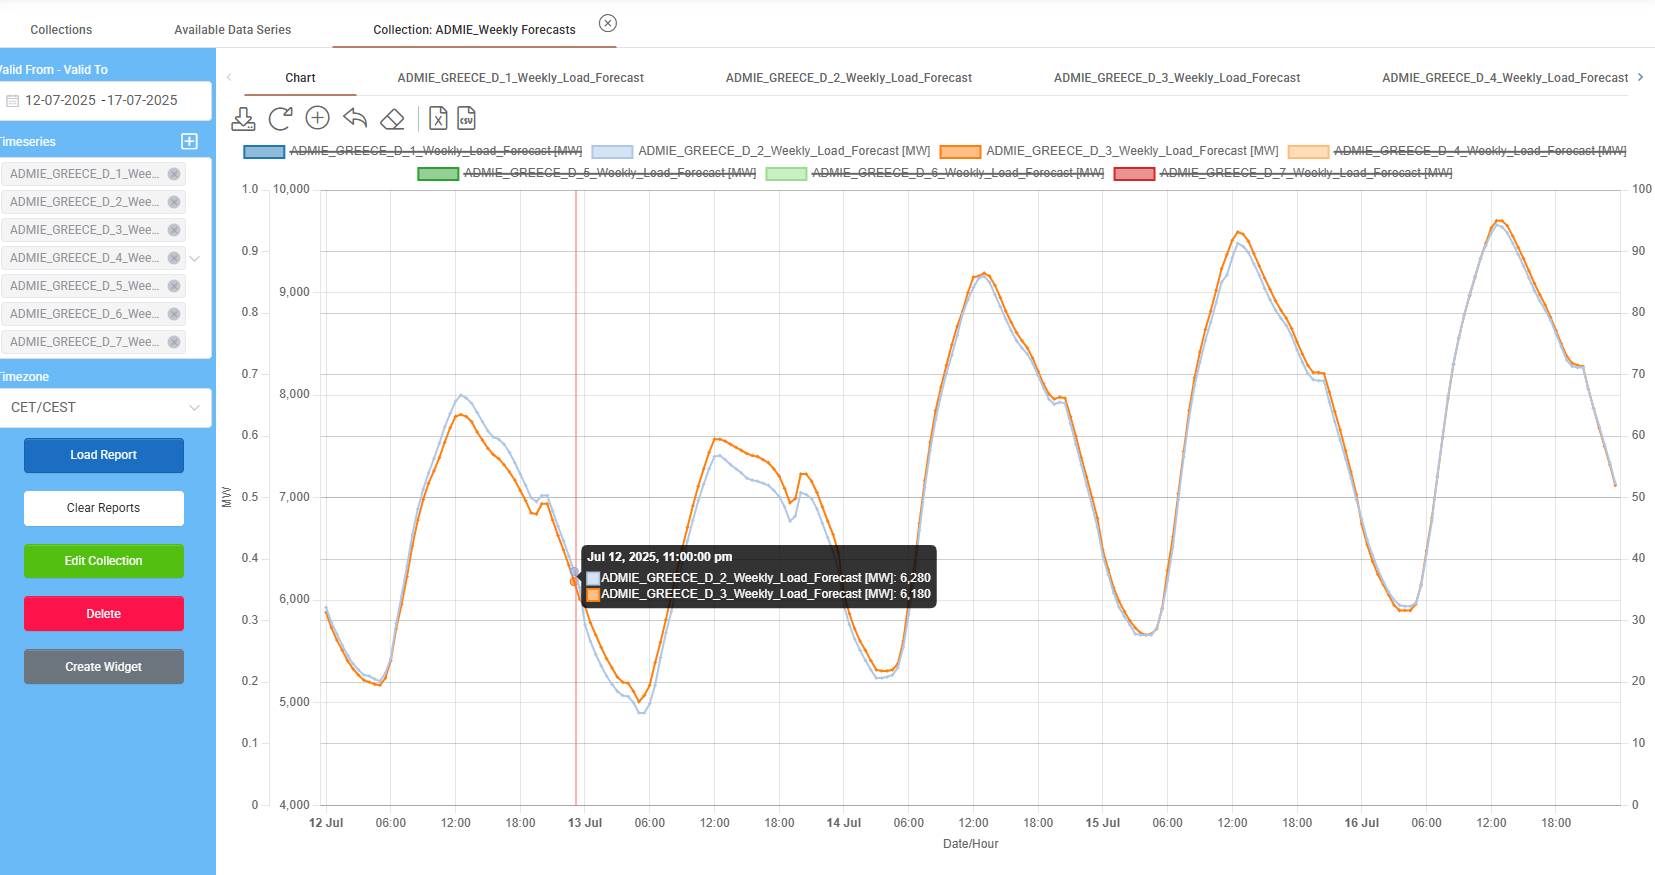
In the left column, a "Create Widget" button will redirect you easily to the creation of widget page which you can customize to have your collections easily viewed in a Dashboard.
Was this helpful?