3.6 Math Editor
Overview of Math editor

The math editor is integrated in the Data Room module to allow the user to make calculations based on the existing time series in the system. A user-friendly command box is available, to insert the appropriate commands and make the calculations. Through the Math Editor, you have great flexibility in creating your own time series and complex calculations, with the help of math operators, pre-defined functions and logical conditions. Essentially, the user will be able to create complex formulas (either prices or volumes) and link these formulas:
a) to deals (thus adjusting to any peculiar type of deal without the need for ad hoc developments). It is the correct combination of the available deal classes with the Math Editor prices and volumes, that allow modelling of all types of contracts in the market.
b) to diagrams and dashboards (for example, the user will be able to calculate ad-hoc Kpis -like the MAPE- on the basis of existing data series and connect them to a dashboard or a widget, thereby obtaining an end-to-end capability of configuring the system).
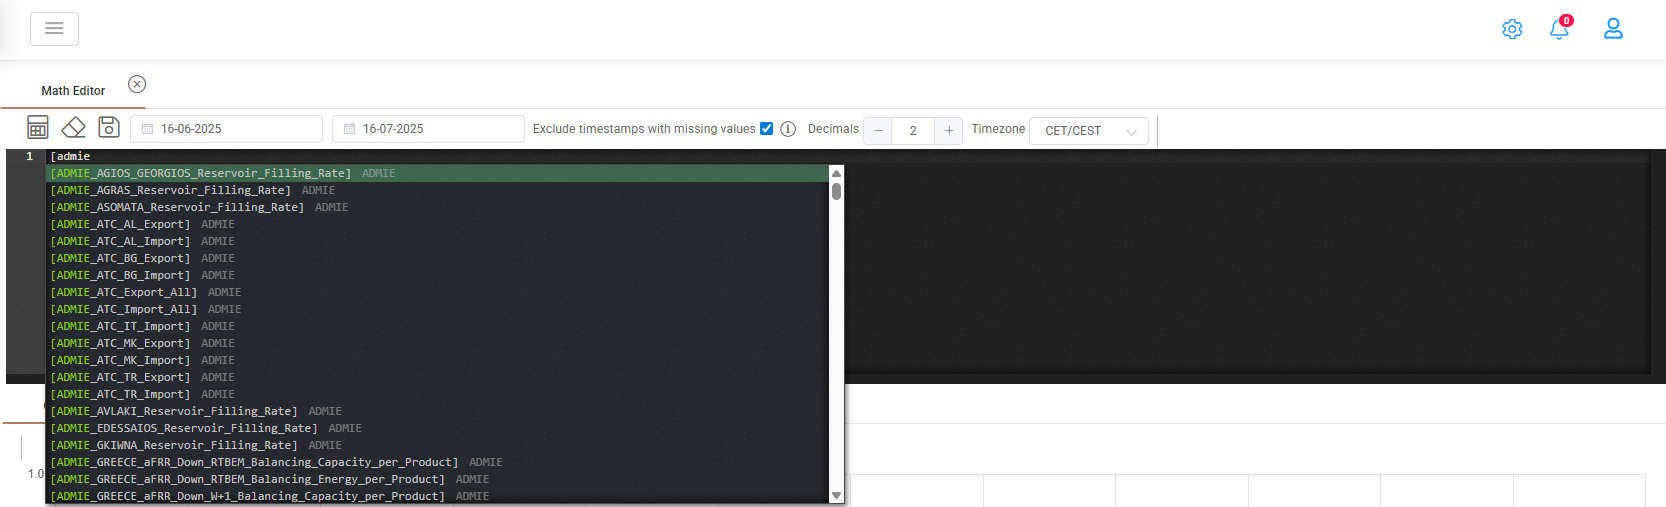
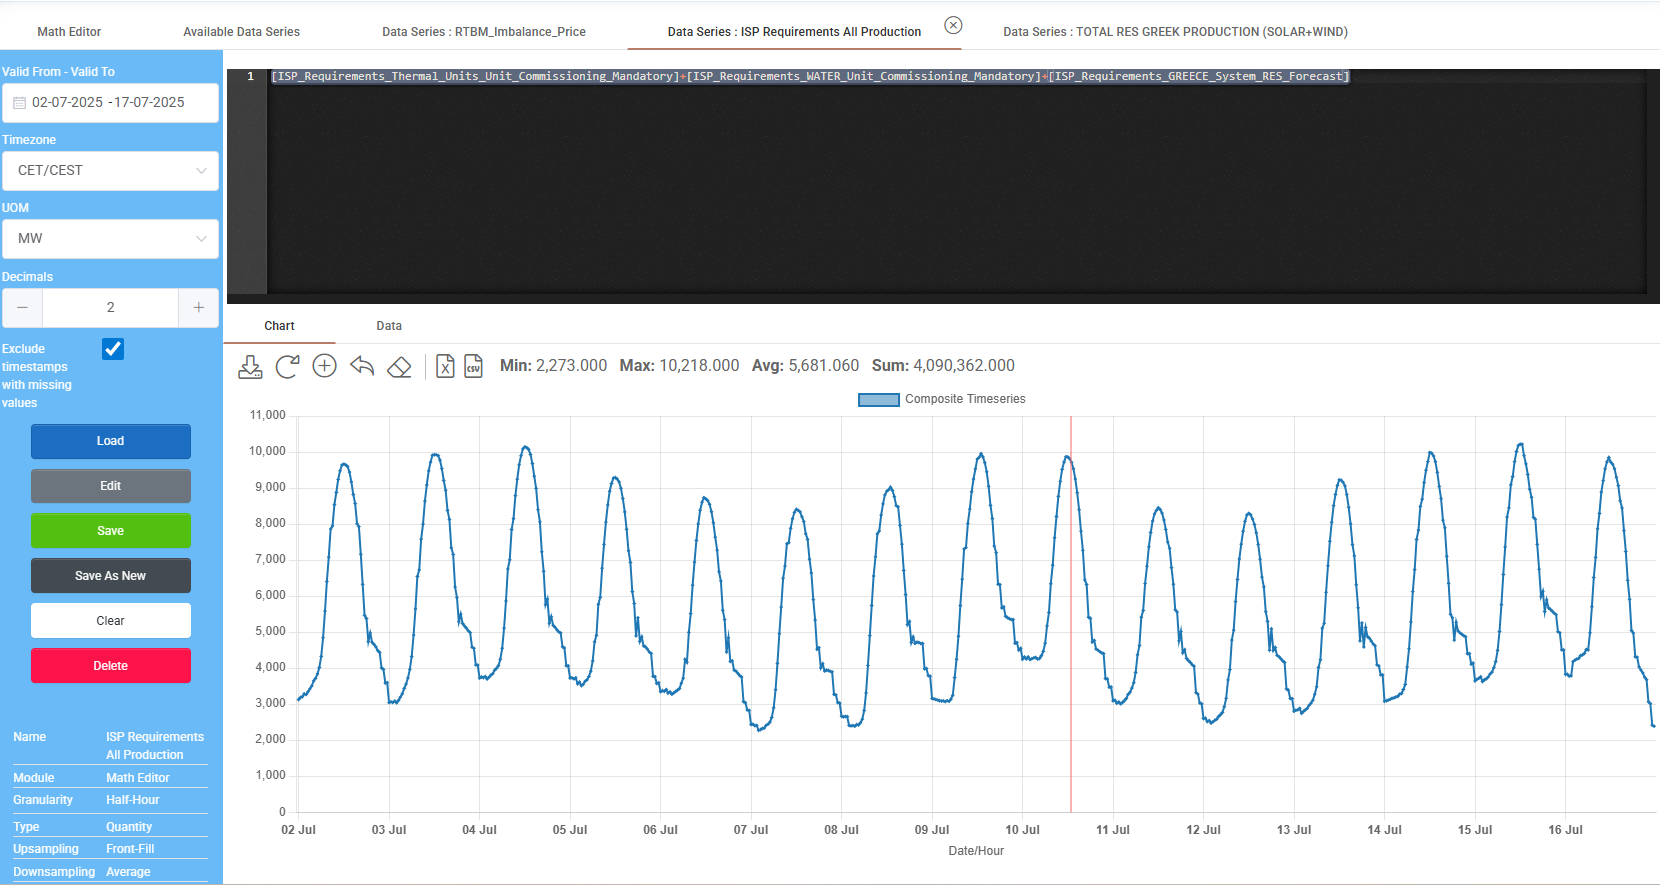
For example, the user will be able to create complex price formulas based on one or different commodities available in the system; or the user will be able to make volume calculations such as adding or prioritizing different profiles available in the system. The user will also be able to calculate ad-hoc KPIs and modify the calculations according to specific needs and chronological availability of data. In the following Figures indicative snapshots of the Math Editor are provided. The user identifies a desired data series in the command editor. Data series in the Math Editor are put inside brackets […]. A drop-down menu makes available all data series of the Data Room and by starting typing the name user can locate specific data series.
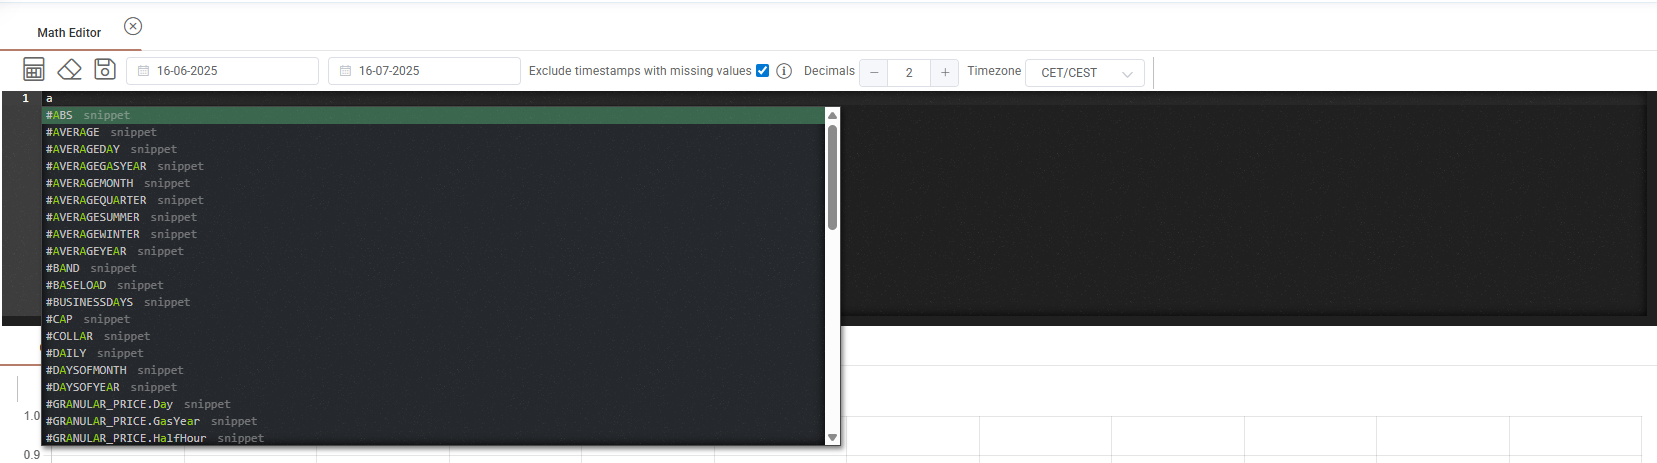
By typing a letter without brackets user can see all available system functions in a drop down menu of Math editor containing the letter you used.
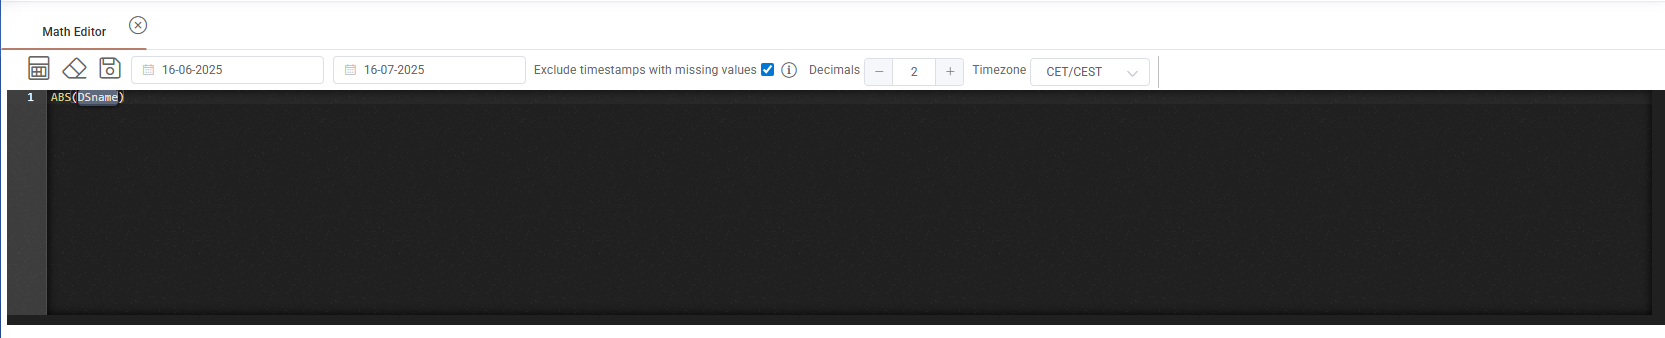
After selection of a function, the system provides the formula for correct implementation assisting on the details than you need to fill.
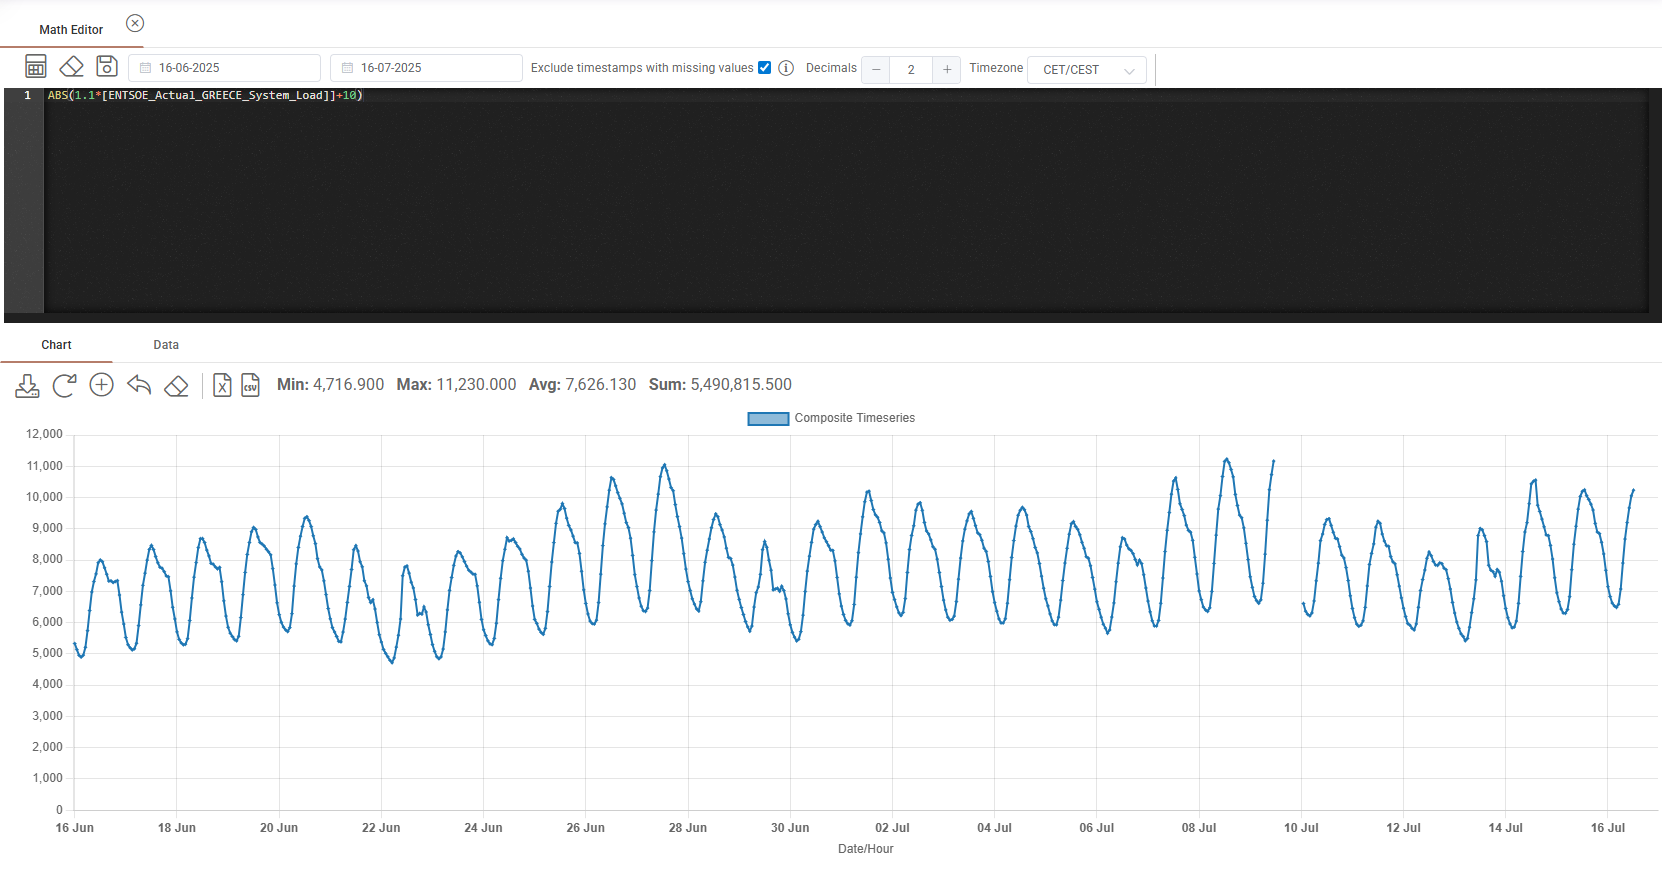
When user fills a complete expression in the Math editor by pressing "calculator" button on the top of the command window, a chart will automatically be generated below with the result. Next to "calculator" icon user can find a "clear" button that clears the command window and a save button that prompts to save the math editor produced data series. User can also, customize the date range that the result is produced, the decimals that will be used at the results of the math editor product and the time zone. Most important is that there is an option to "exclude timestamps with missing values", ensuring your generated data series will have not gaps.
The system will dynamically update the result of the new data series any time the underlying indexes / volumes used in this formula are updated from the market (e.g., when updated prices or volumes are obtained from a third-party like a power exchange or the TSO). The resulting data series can then be used in other modules, e.g., as a profile or a price in a given deal (Deal Capturing), in the Dashboard to follow certain KPIs, an ad-hoc market analysis, etc.
Certain functions allow the user to perform time handling of the data series which are often when conducting energy market analysis, such as:
shift forward;
identify the value of the last day of month (e.g., applicable in certain gas products);
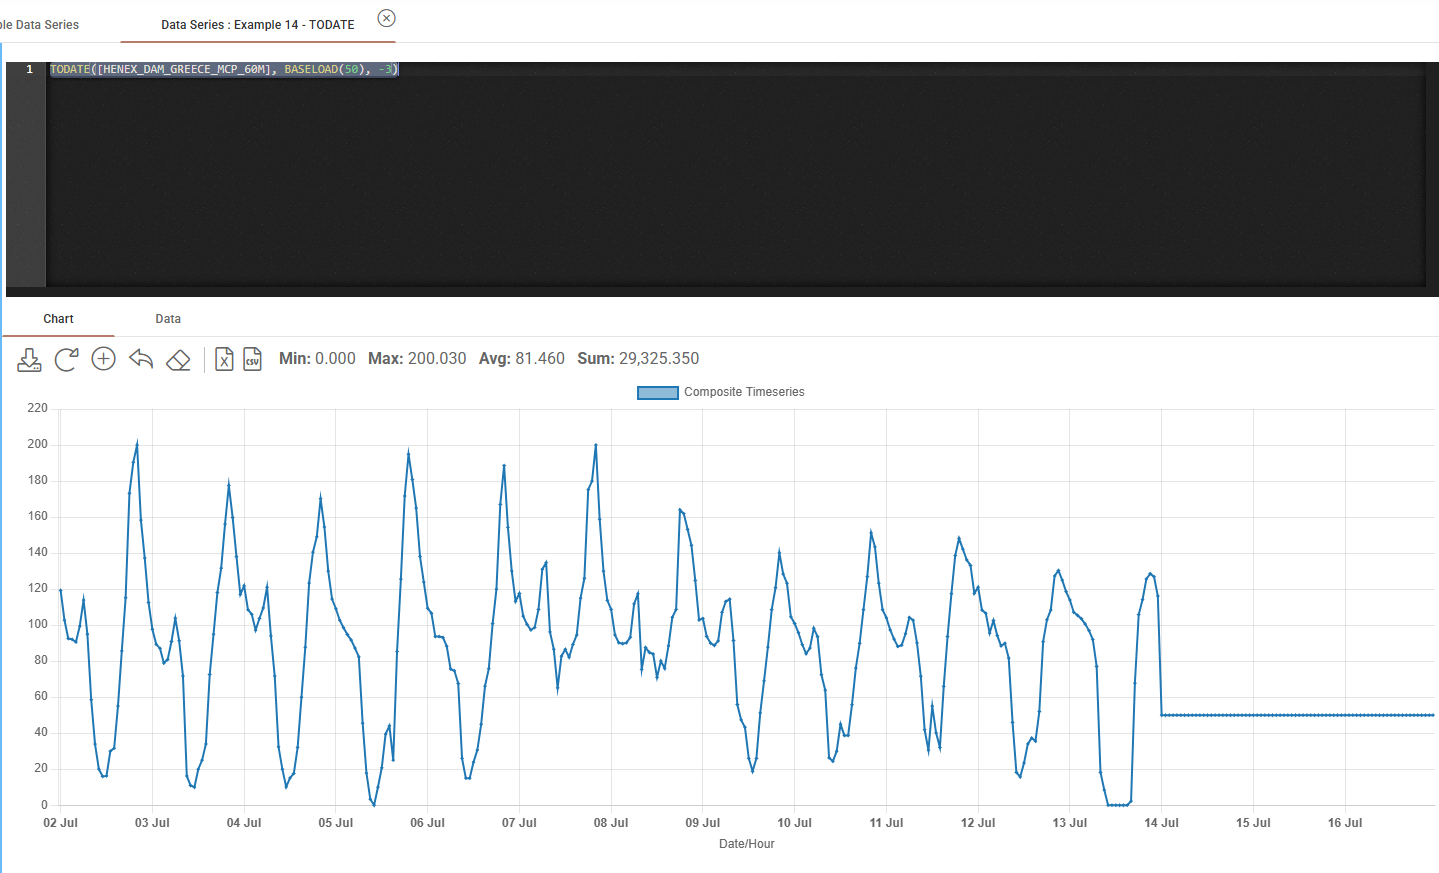
connect two time series, one representing the realized part until a dynamically-defined day (e.g. Today+1) and another representing the unrealized (forecast) part from that day onwards; etc.
The data of the calculated time series can also be downloaded as excel or csv files.
Was this helpful?