3.7 Offer Curves
Overview
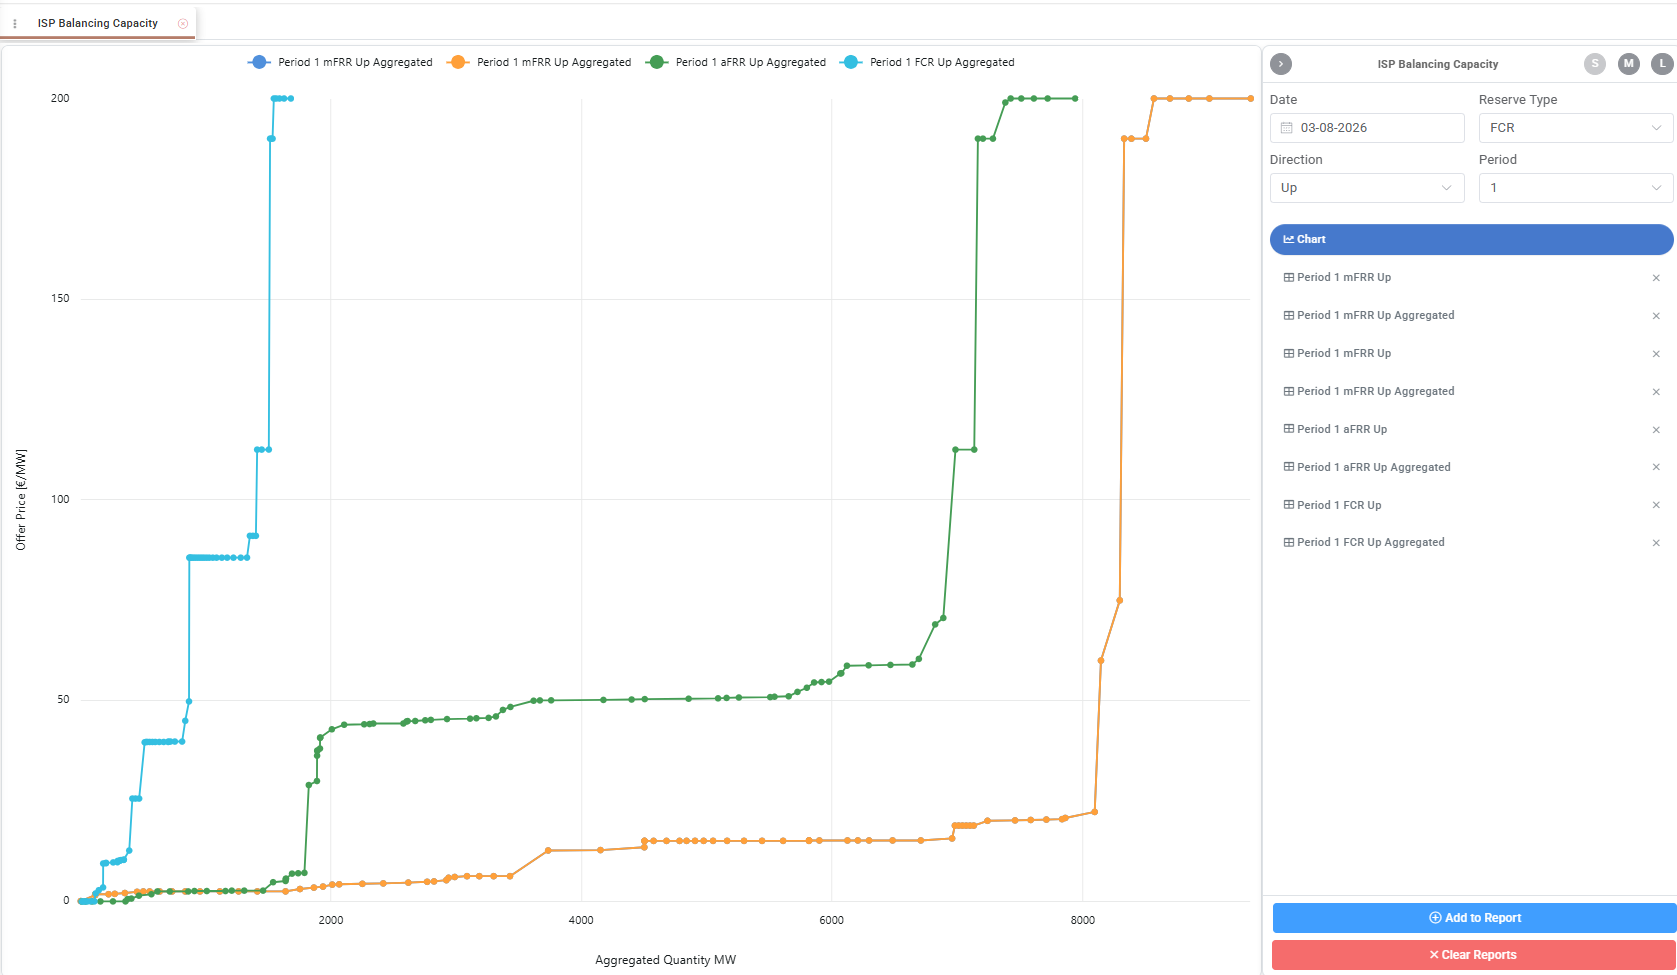
Offer curves represent the relationship between offered quantity and price across different electricity market segments. They provide insight into market depth, price sensitivity and the availability of energy or capacity at different price levels.
By comparing curves across markets, products and delivery periods, users can monitor changes in offer competitiveness, reserve procurement and price formation, supporting both current market analysis and the review of historical market behaviour.
ATLAS includes offer curves for ISP Balancing Energy, ISP Balancing Capacity and HEnEx spot markets.
ISP Balancing Energy
ISP Balancing Energy curves can be examined by direction, either Up or Down. They show the energy available for balancing activation and its corresponding offer price.
ISP Balancing Capacity
ISP Balancing Capacity curves can additionally be examined by reserve type, such as FCR, aFRR or mFRR. They show the available reserve capacity and its offer price.
HEnEx Aggregated Curves
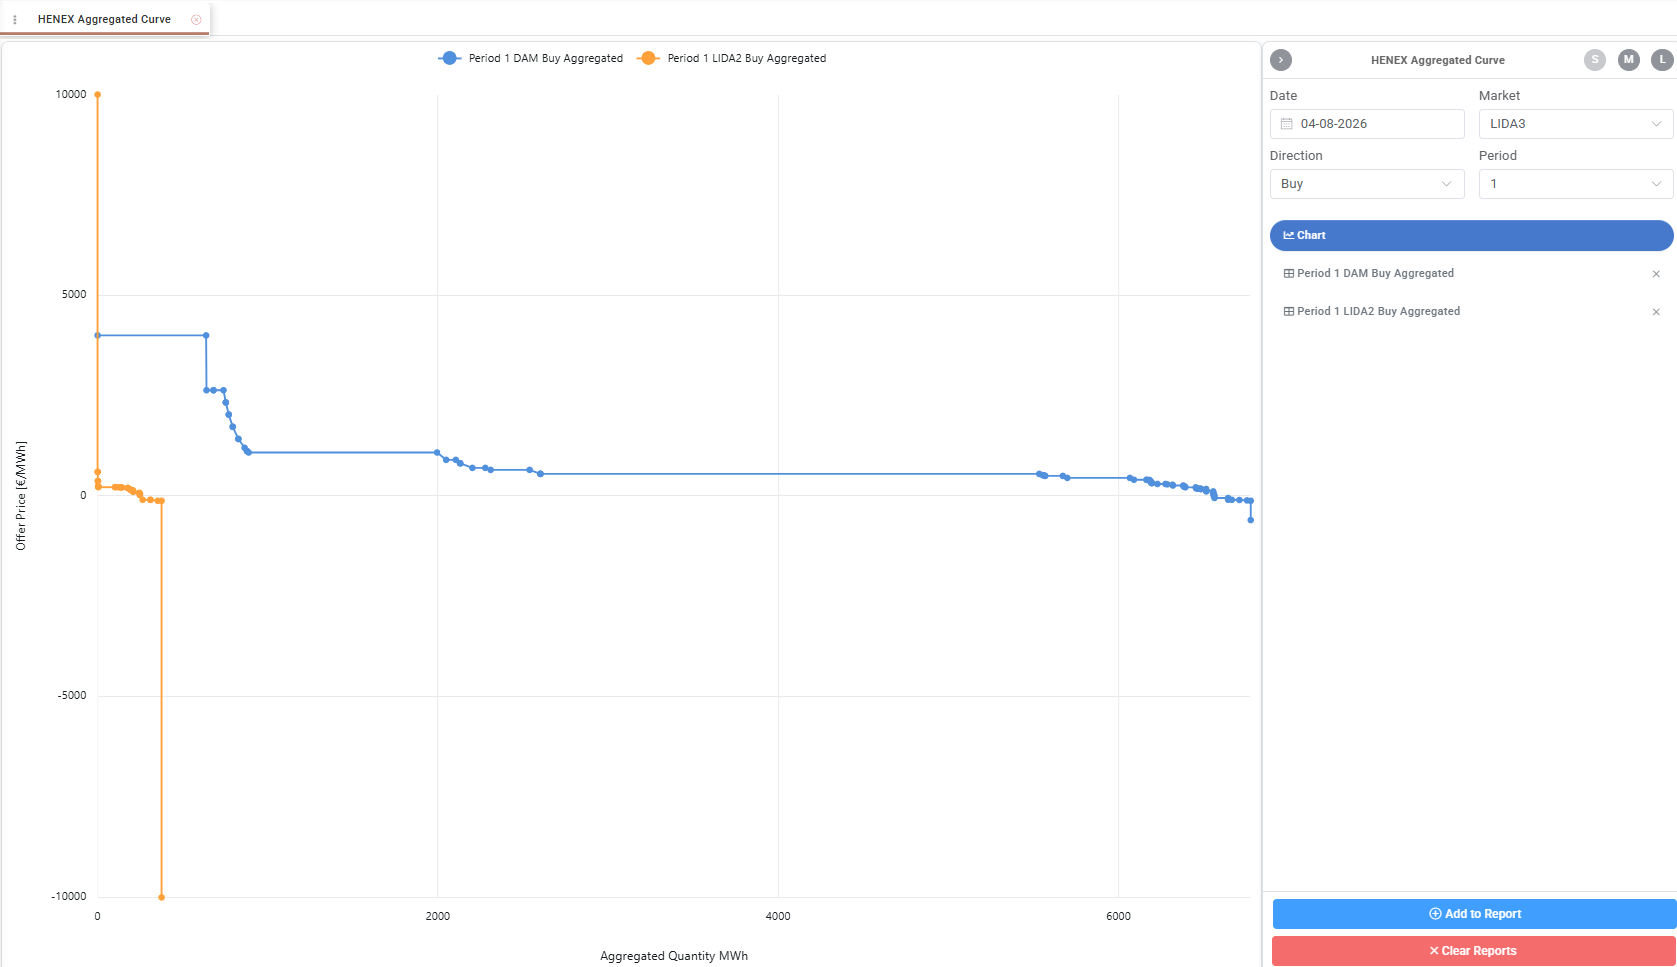
HEnEx curves present cumulative Buy or Sell orders for the selected spot market. Curves from different markets, such as DAM and LIDA1, can be displayed together to compare their price and quantity distribution.
Working with Offer Curves
The displayed curve is defined by the selected date and delivery period, together with the parameters relevant to each market. Add to Report loads the selected curve without replacing existing reports, enabling comparisons across periods, directions, reserve products or markets.
The Chart view displays all loaded curves together. Individual curves can be temporarily hidden through the chart legend. Reports can be removed separately from the side panel, while Clear Reports resets the workspace.
Individual and Aggregated ISP Data
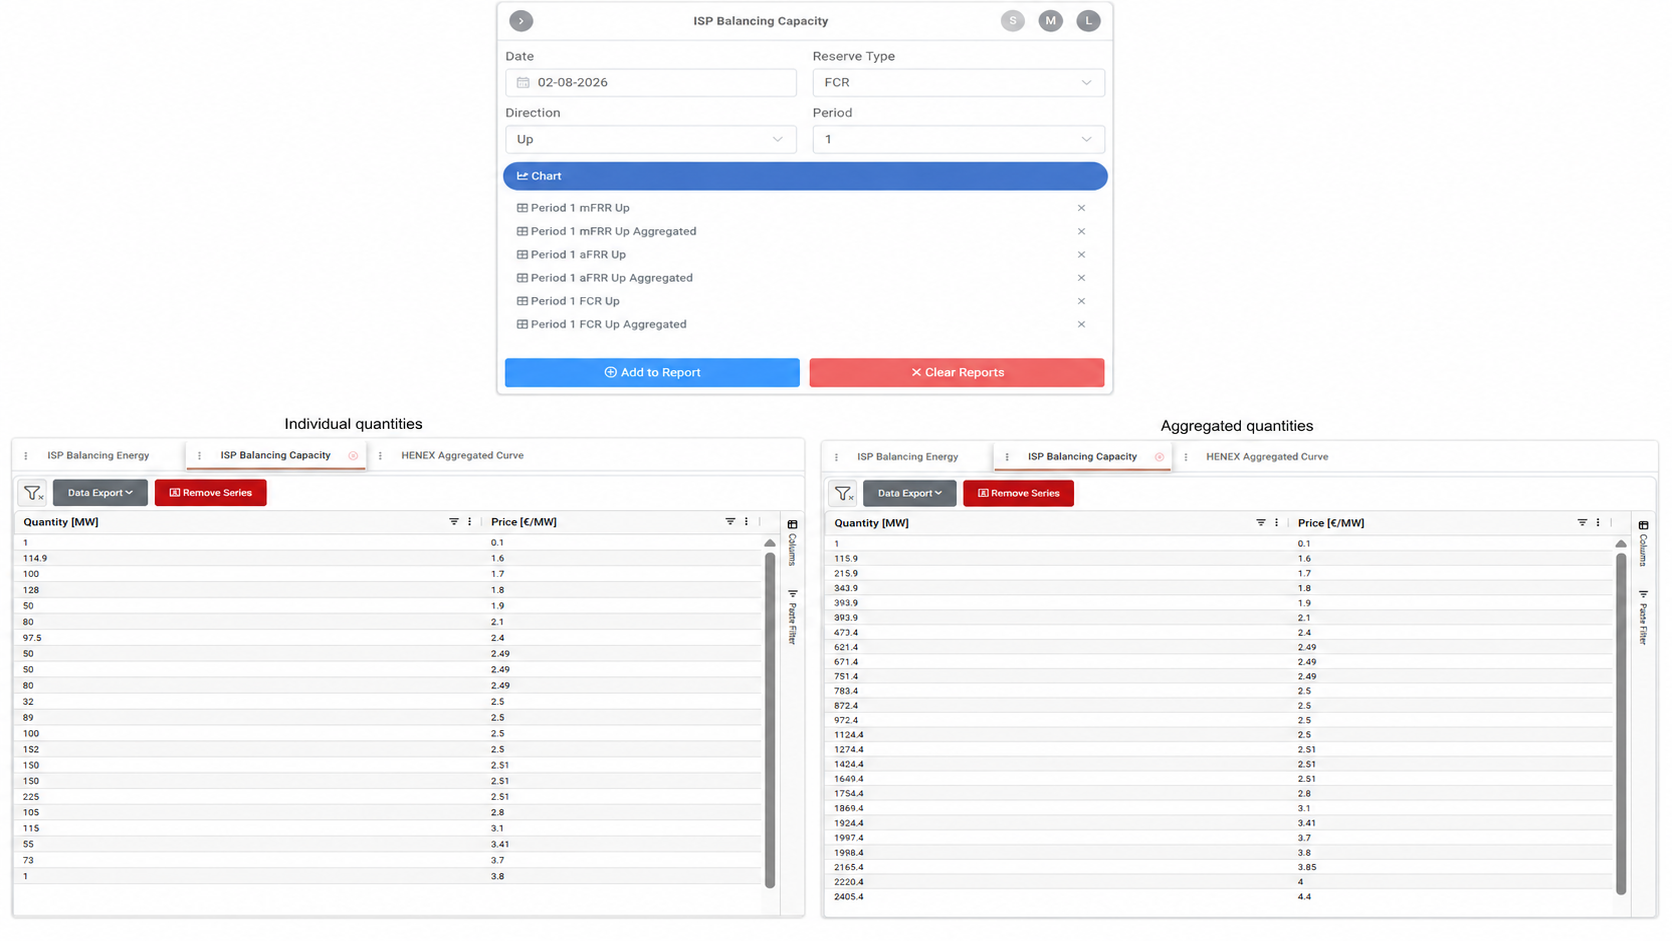
Each ISP selection generates an individual and an aggregated data series. The individual series shows the quantity offered at each price level, while the aggregated series shows the cumulative quantity available up to that price.
For example, if 1 MW is offered at €0.10/MW and a further 114.9 MW at €1.60/MW, the aggregated quantity at the second price level is 115.9 MW. The aggregated series forms the offer curve displayed in the chart.
Report Data
Selecting a report opens its underlying quantity and price data in a grid. The data can be filtered or exported, while Remove Series removes selected series from the report.
Appendix - Field Details
Field / Element | Description |
|---|---|
Date | Reference date for which the offer curve is retrieved. |
Market | HEnEx market segment represented by the curve. Available options: DAM, LIDA1, LIDA2, LIDA3. |
Reserve Type | Reserve product represented by an ISP Balancing Capacity curve. Available options: FCR, aFRR or mFRR. |
Direction | Direction of the curve. Available values depend on the selected view: Up/Down for ISP curves and Buy/Sell for HEnEx curves. |
Period | Delivery period represented by the curve. For quarter-hourly markets, periods typically range from 1 to 96. |
Quantity | Offered energy or capacity. Expressed in MWh for energy curves and MW for capacity curves. |
Aggregated Quantity | Cumulative quantity available up to the corresponding offer price. |
Price | Offer price. Expressed in €/MWh for energy curves and €/MW for capacity curves. |
Chart | Displays the loaded reports as offer curves. |
Add to Report | Adds the selected curve to the workspace without replacing previously loaded reports. |
Clear Reports | Removes all reports from the workspace. |
Data Export | Exports the data of the selected report (in Excel or CSV). |
Remove Series | Removes selected series from the report and chart. |
Was this helpful?