Overview
The Market Results screen provides access to the official market clearing outcomes, once the market operator publishes them. It is used to check the clearing prices of each market and the results of the bidding entities, such as the market schedule and the quantities bought and sold, and to compare them with the orders that were submitted.
The user selects the date range and the market for which the results are displayed. The available markets are the spot markets of the deployment, such as DAM, IDA1, IDA2, IDA3 and XBID, and the next trading day is selected by default.
The results are retrieved automatically from the market operator through scheduled jobs and are stored as timeseries in the Data Room. This allows them to be used in portfolio management, risk analysis, settlement and dashboards, in addition to the screen itself.
The screen is organized in four tabs. The Clearing Prices and Market Results tabs present the data in tabular form, and the Clearing Prices Chart and Market Results Chart tabs present the same data graphically.
Viewing Results
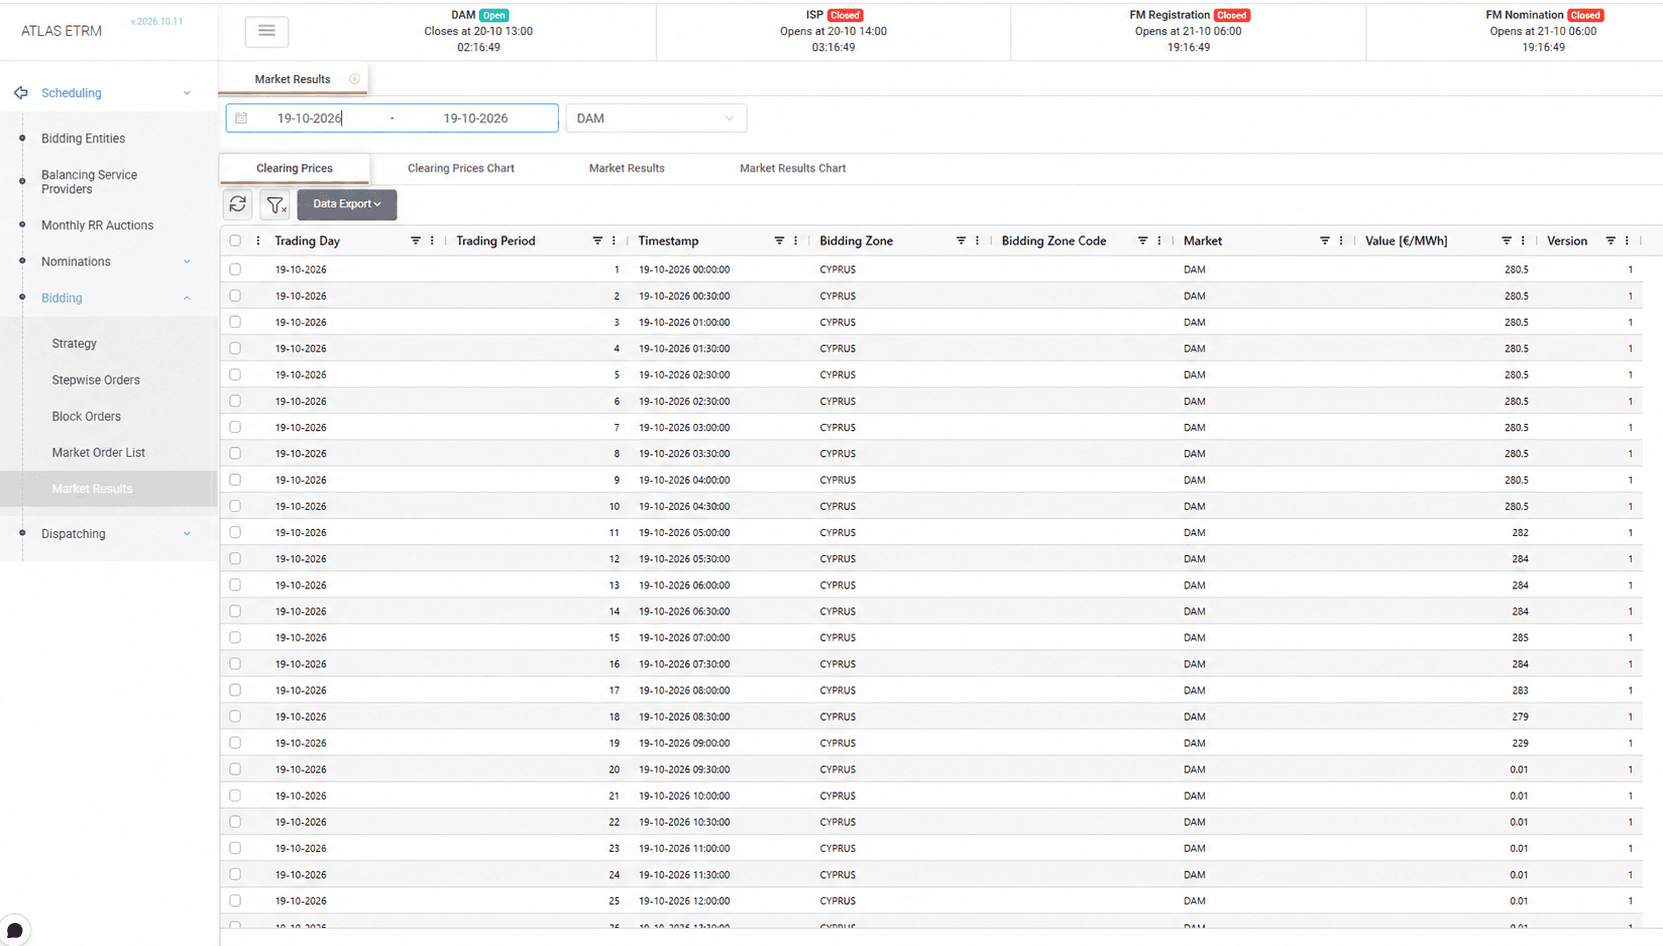
The Clearing Prices tab displays the market clearing price for each trading period, per bidding zone and market.
The Market Results tab displays the results per bidding entity, which include the market schedule and the quantities bought and sold in each trading period. Quantities are displayed in MW or MWh, depending on the market, and trading periods follow the granularity of the market.
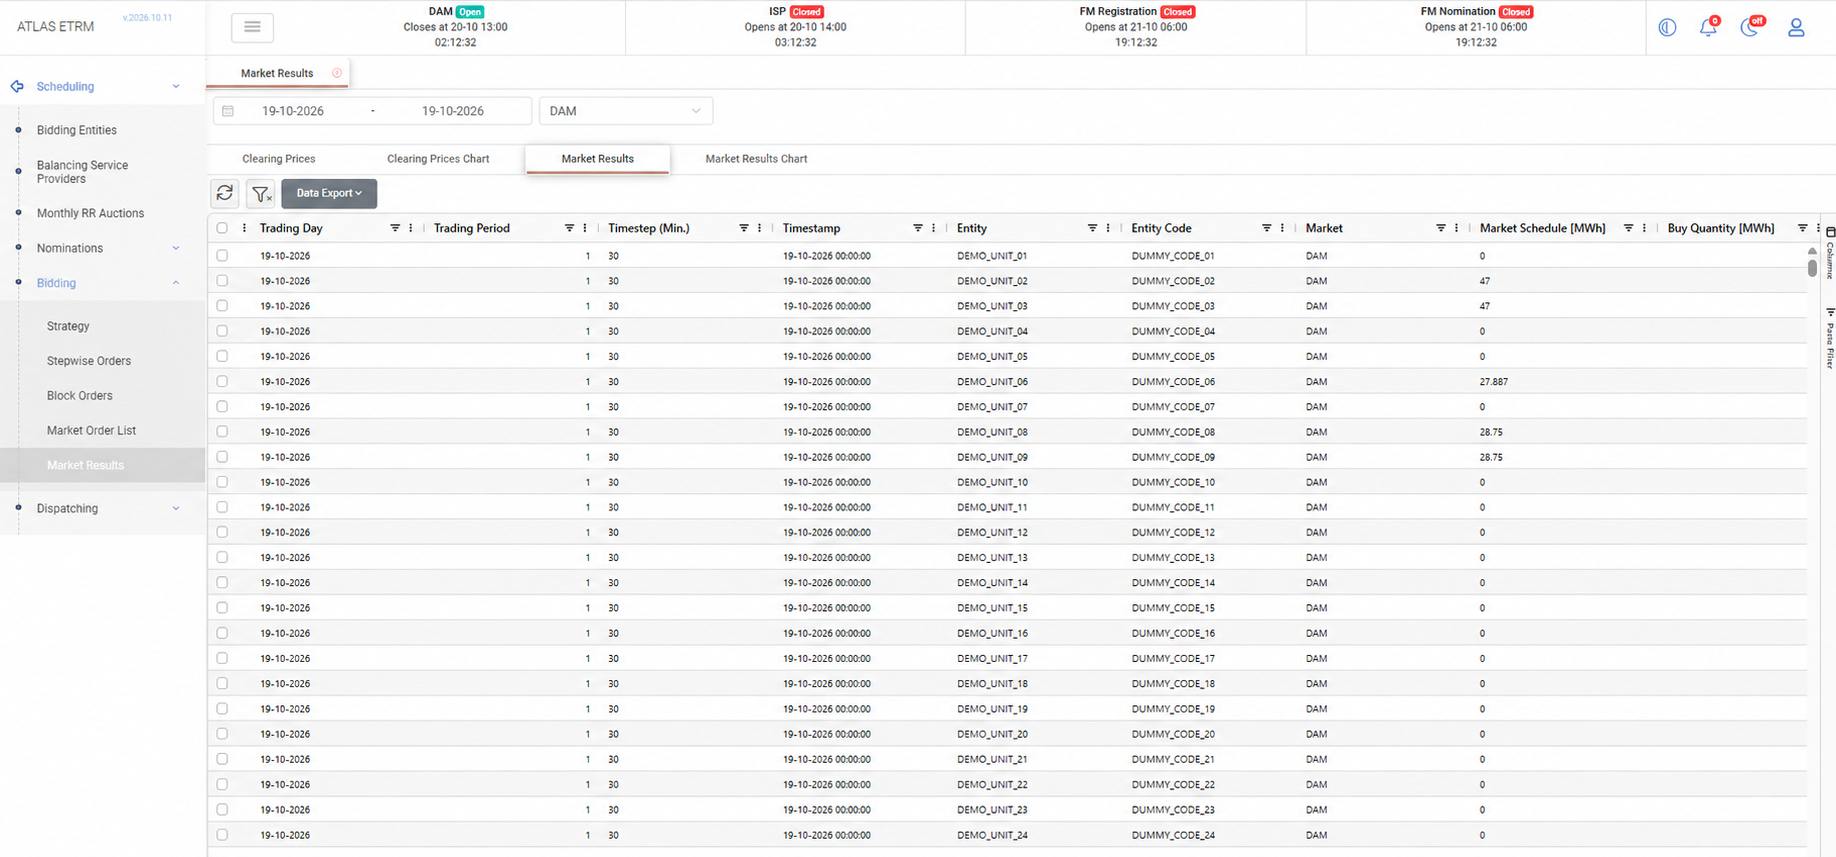
Both grids support grouping, filtering and data export through the Data Export option. The user can choose the displayed columns through the Columns panel, and the first columns remain visible while scrolling horizontally, so that the values are always read next to their trading period.
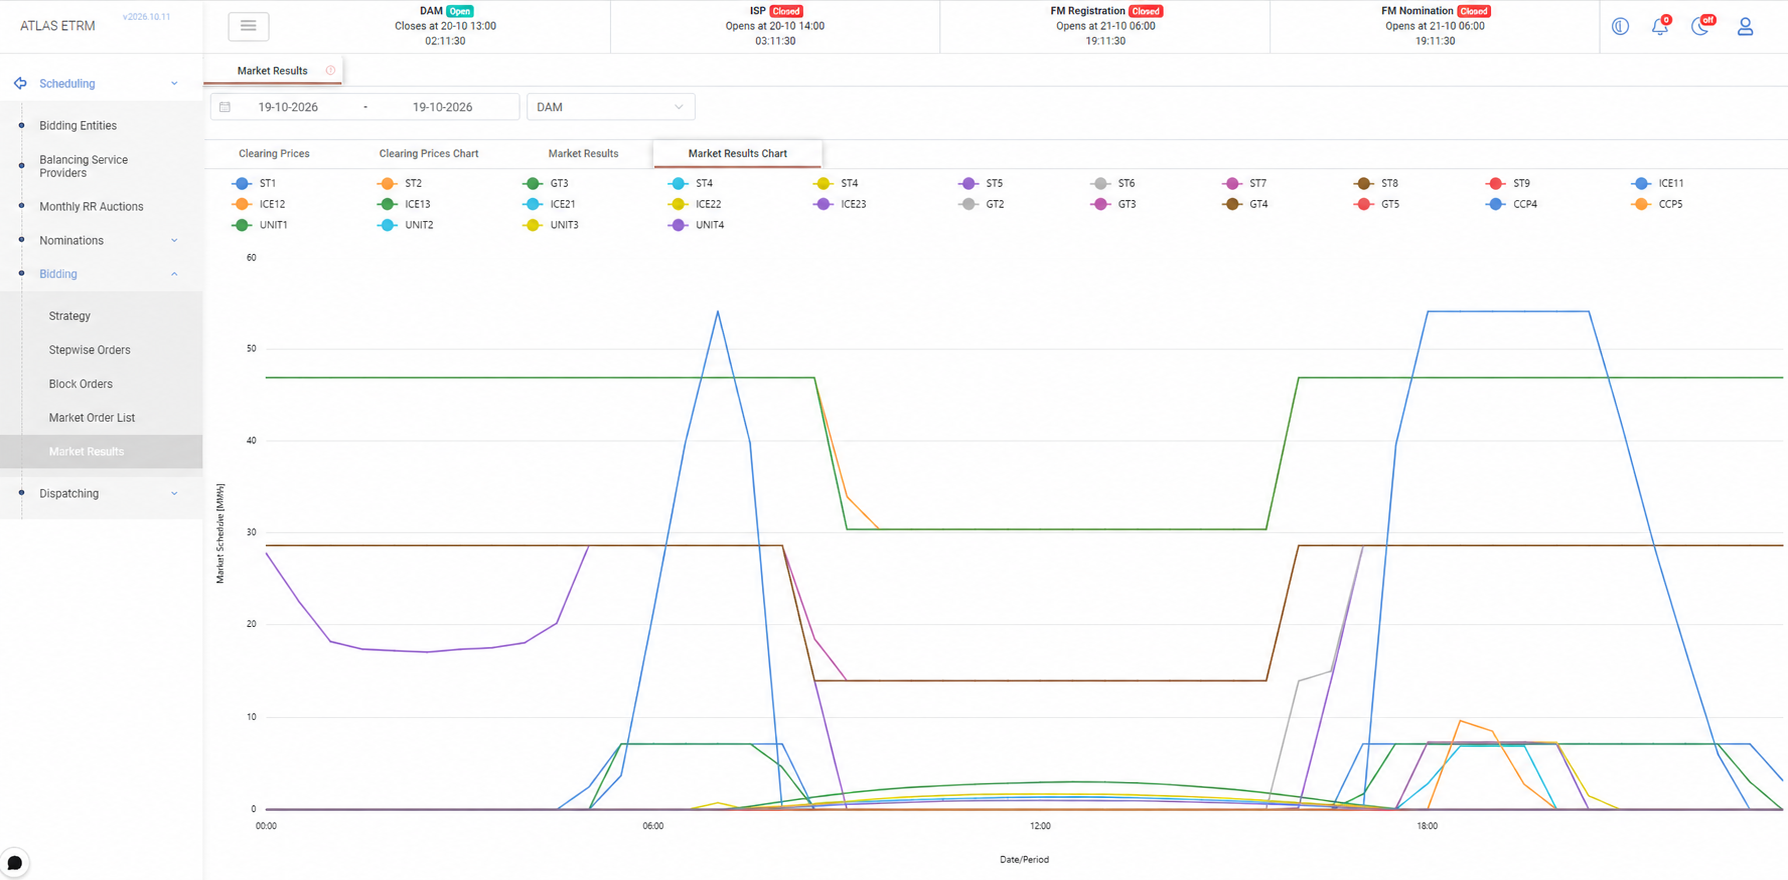
The Clearing Prices Chart tab displays the clearing prices grouped by bidding zone and market, while the Market Results Chart tab displays the results grouped by bidding entity and market. In both charts, the horizontal axis combines the trading day and the trading period, so that results of more than one day can be compared in a single chart.
Appendix - Field Details
Screen controls
Field / Element | Description |
|---|---|
Date range | Trading dates for which the results are displayed. By default, the next trading day is selected. |
Market | Market for which the results are displayed. The available markets depend on the deployment. |
Refresh | Reloads the results of the selected date range and market. |
Clear filters | Removes the active filters of the grid. |
Data Export | Exports the grid to Excel or CSV. |
Tabs
Tab | Description |
|---|---|
Clearing Prices | Grid with the market clearing prices per trading period, bidding zone and market. |
Clearing Prices Chart | Chart of the clearing prices, grouped by bidding zone and market. |
Market Results | Grid with the results of each bidding entity, such as the market schedule and the buy and sell quantities. |
Market Results Chart | Chart of the results of the bidding entities, grouped by entity and market. |
Clearing Prices grid
Field / Element | Description |
|---|---|
Trading Day | Delivery day of the result. |
Trading Period | Trading period of the delivery day, according to the granularity of the market. |
Timestamp | Date and time of the start of the trading period. |
Bidding Zone | Name of the bidding zone to which the price applies. |
Bidding Zone Code | Code of the bidding zone. |
Market | Market to which the result belongs, such as DAM or an IDA. |
Value [€/MWh] | Market clearing price. |
Version | Version of the published result. |