Viewing Your Data Panels
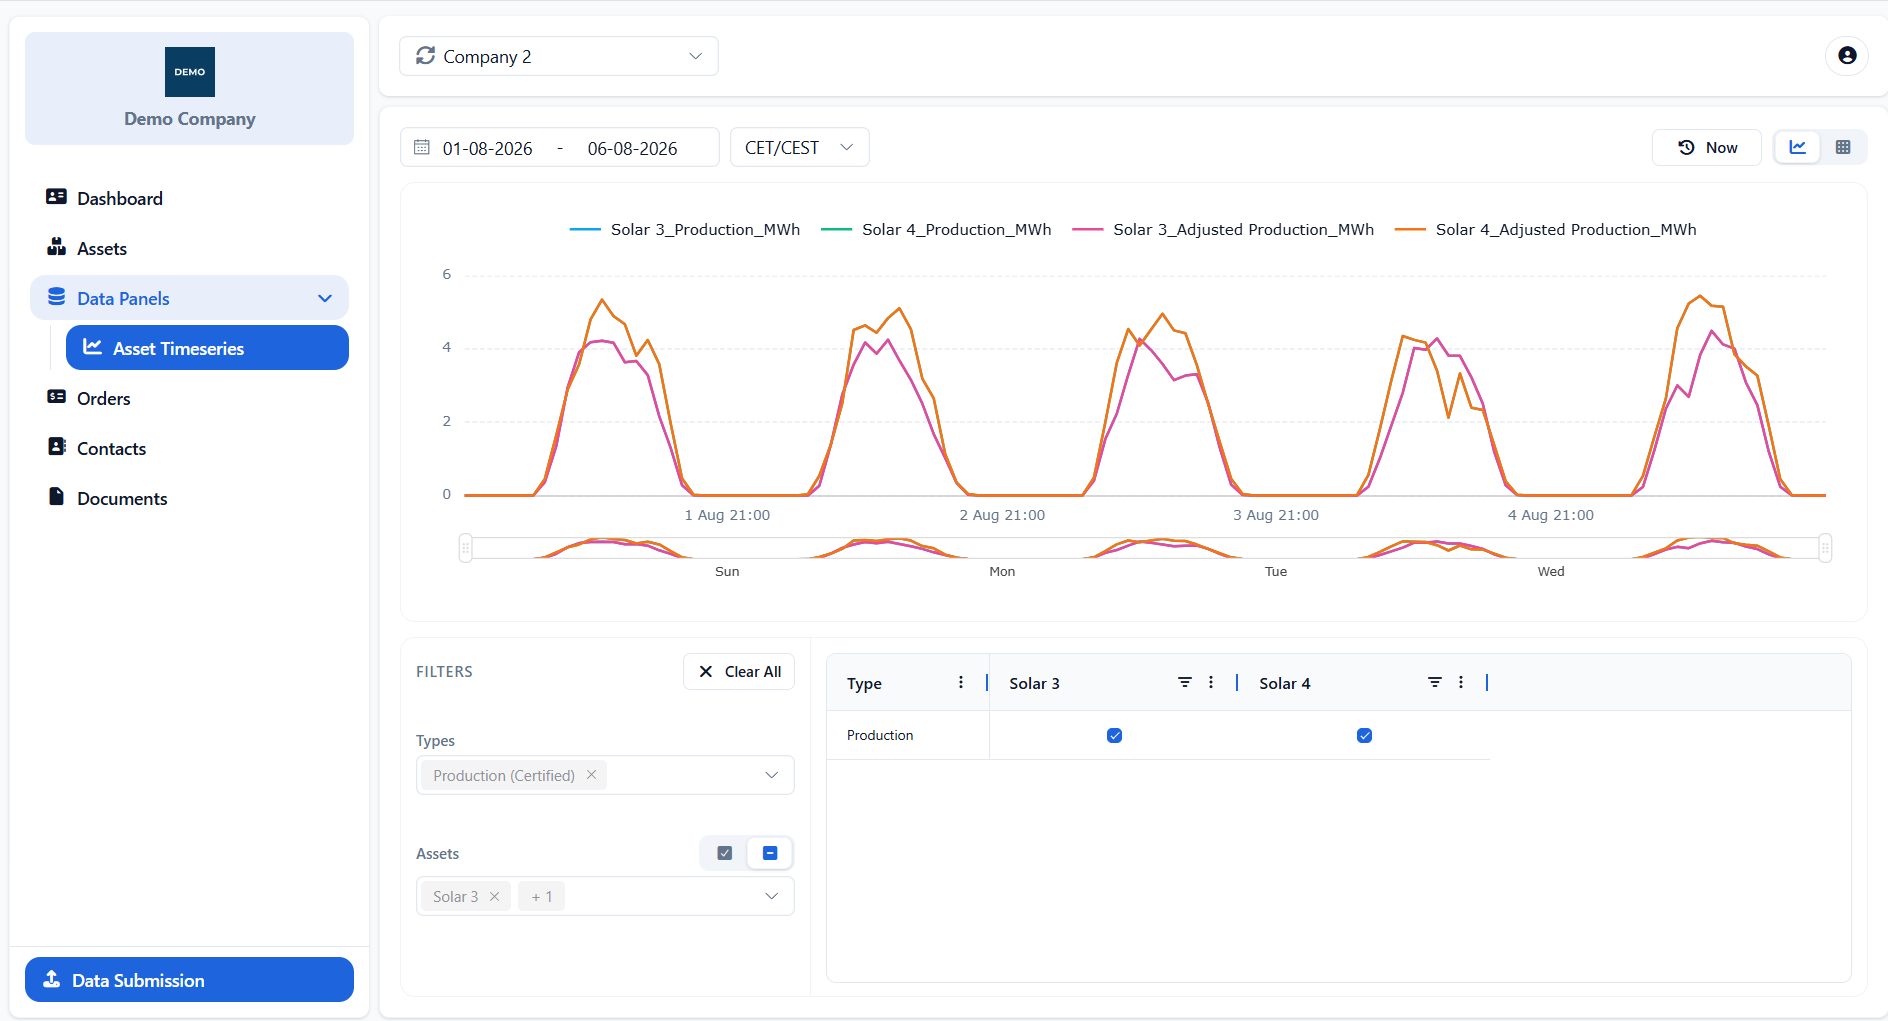
The Data Panels section provides access to timeseries information associated with the selected company. The available panel, Asset Timeseries, allows users to review and compare measurements from one or more assets over a selected period.
Selecting the Period and Timezone
Use the date picker to define the period displayed. The Timezone selector determines how timestamps are presented, with available options including UTC, CET/CEST, EET/EEST and GAS.
Selecting Now automatically changes the date range to the current day.
Selecting Timeseries and Assets
The Filters area is used to select one or more timeseries types and assets. The grid shows the available Type × Asset combinations, where individual series can be selected or cleared using the corresponding checkboxes.
Clear All removes the current type and asset selections.
Viewing the Results
In Chart view, each selected timeseries is displayed as a separate line. The legend identifies the corresponding asset or measurement and can be used to temporarily show or hide individual series. Hovering over the chart displays the timestamp and values for the selected point.
The range control below the chart can be adjusted to focus on a shorter part of the selected period.
Table View and Export
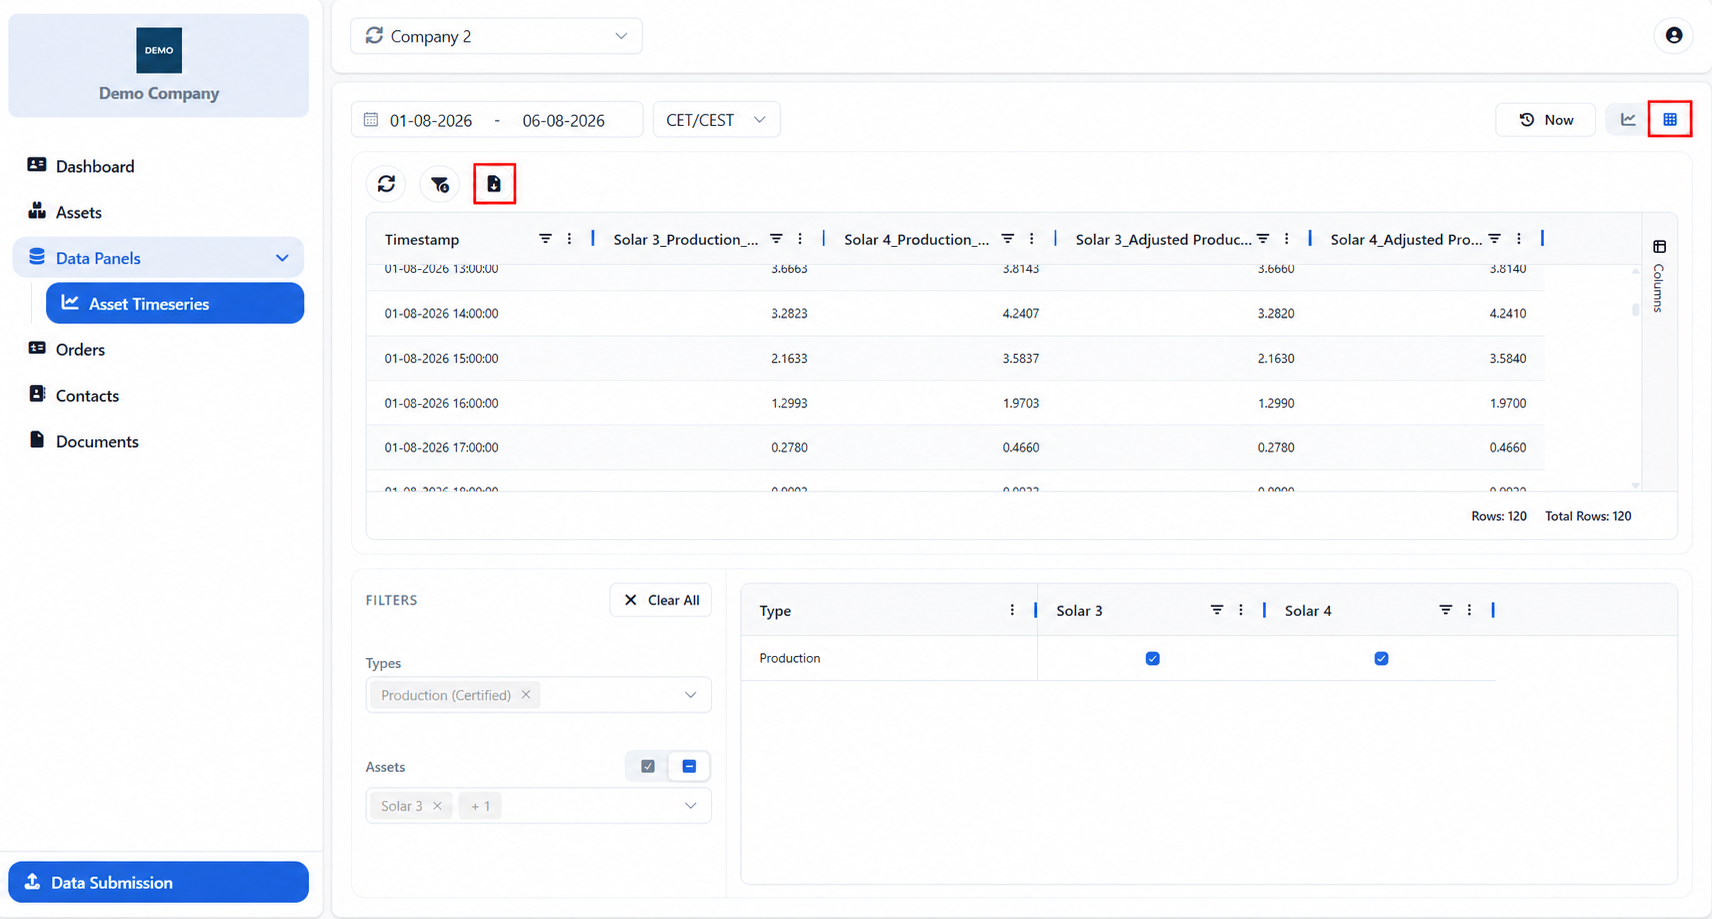
The view selector in the top-right corner switches between the chart and the underlying table. Table view presents the values by timestamp and allows the displayed data to be downloaded in Excel or CSV format.
Appendix - Field Details
Field / Element | Description |
|---|---|
Date Range | Defines the period for which timeseries data is displayed. |
Timezone | Determines the timezone used for the displayed timestamps. Available options include UTC, CET/CEST, EET/EEST and GAS. |
Now | Changes the selected date range to the current day. |
Chart / Table View | Switches between the timeseries chart and the underlying values in table format. |
Types | Multi-select field for choosing the timeseries measurement types to display. |
Assets | Multi-select field for choosing the assets included in the results. |
Select All / Deselect All | Selects or clears all available assets. |
Clear All | Removes all current type and asset selections. |
Selection Grid | Displays the available Type × Asset combinations and allows individual timeseries to be selected. |
Chart Legend | Identifies the displayed series and allows them to be temporarily shown or hidden. |
Range Control | Narrows the visible section of the selected period without changing the original date range. |
Export | Downloads the timeseries values from Table view in Excel or CSV format. |
Was this helpful?