Available Data Series
Overview
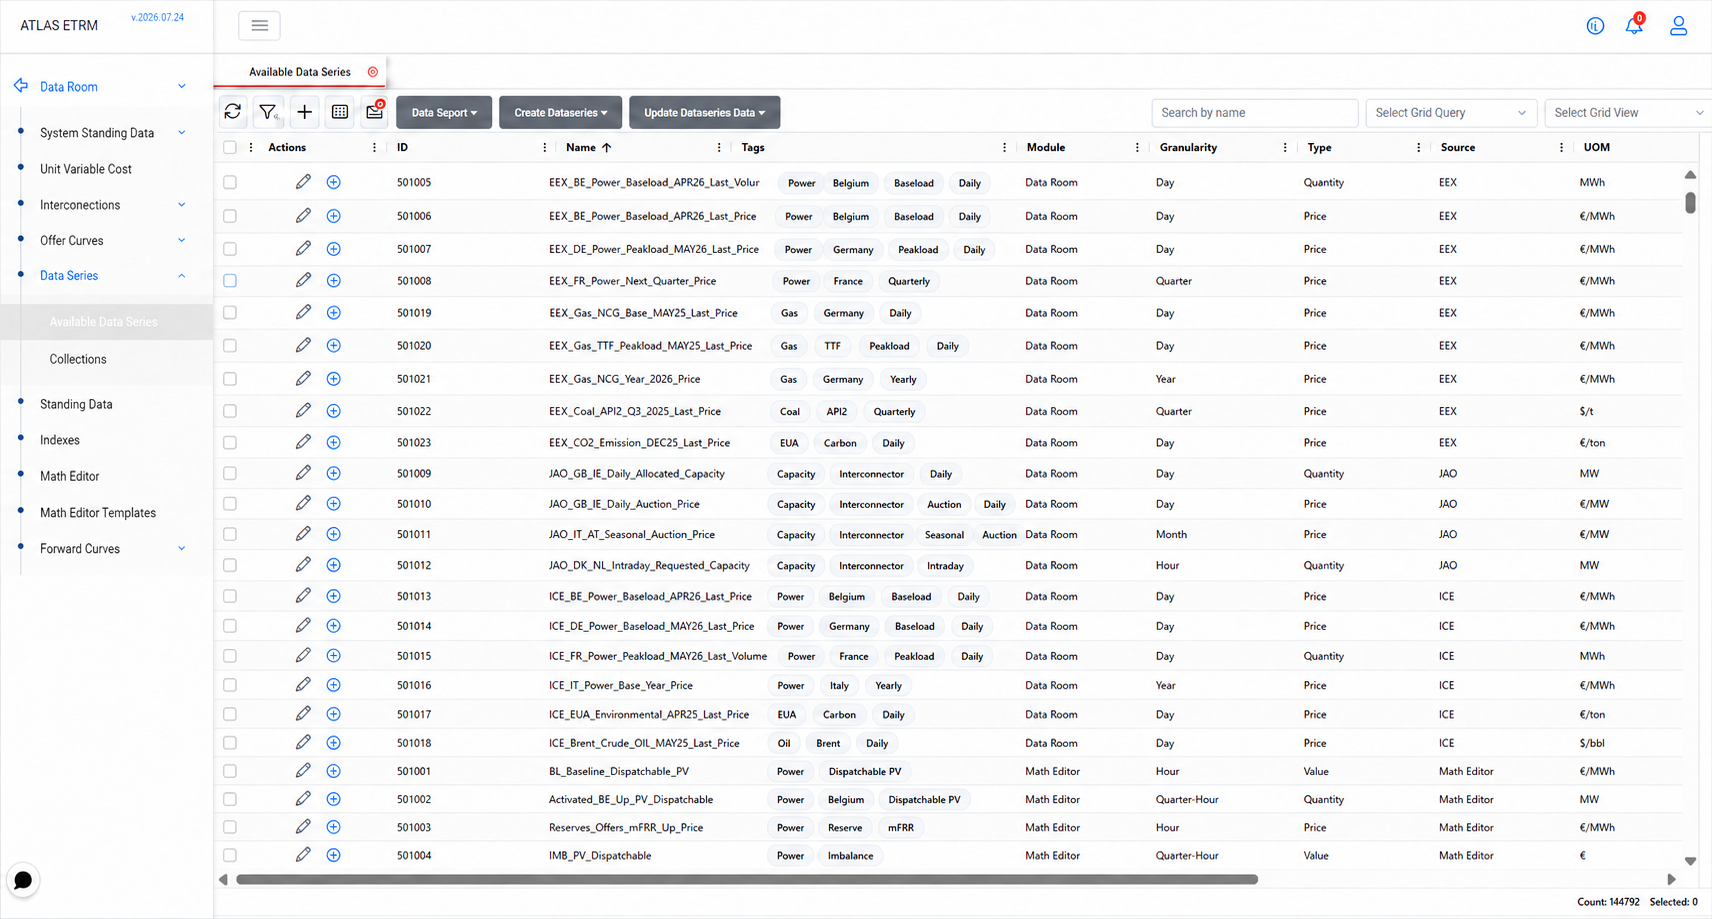
The Available Data Series screen provides a central view of all data series registered in ATLAS. The searchable and filterable grid displays the key metadata required to identify and understand each series.
From this screen, users can review individual series and perform the actions required to create and manage data series and their values.
System-generated data series follow a standardised naming convention:
{Provider}{Tag1}{Tag2}…{TagN}_{Dataset}
Provider indicates the data source, Tags describe the relevant entity or market context, such as the bidding zone, country, or unit EIC, and Dataset identifies the specific dataset. This structure helps users recognise and locate data series consistently across ATLAS.
Filtering and Queries
Grid Queries
Grid queries can be created either through the query row above the grid or through the Builder. In both cases, users define filtering rules by selecting a field, choosing an operator, and entering the desired value. The Builder supports more advanced queries by allowing multiple rules to be combined using AND/OR logic.
Queries can be saved through the Select Grid Query drop-down. When saving a query, users can also associate it with a grid view containing settings such as column selection and order, grouping, and other grid configurations.
For more information, see Queries and Views.
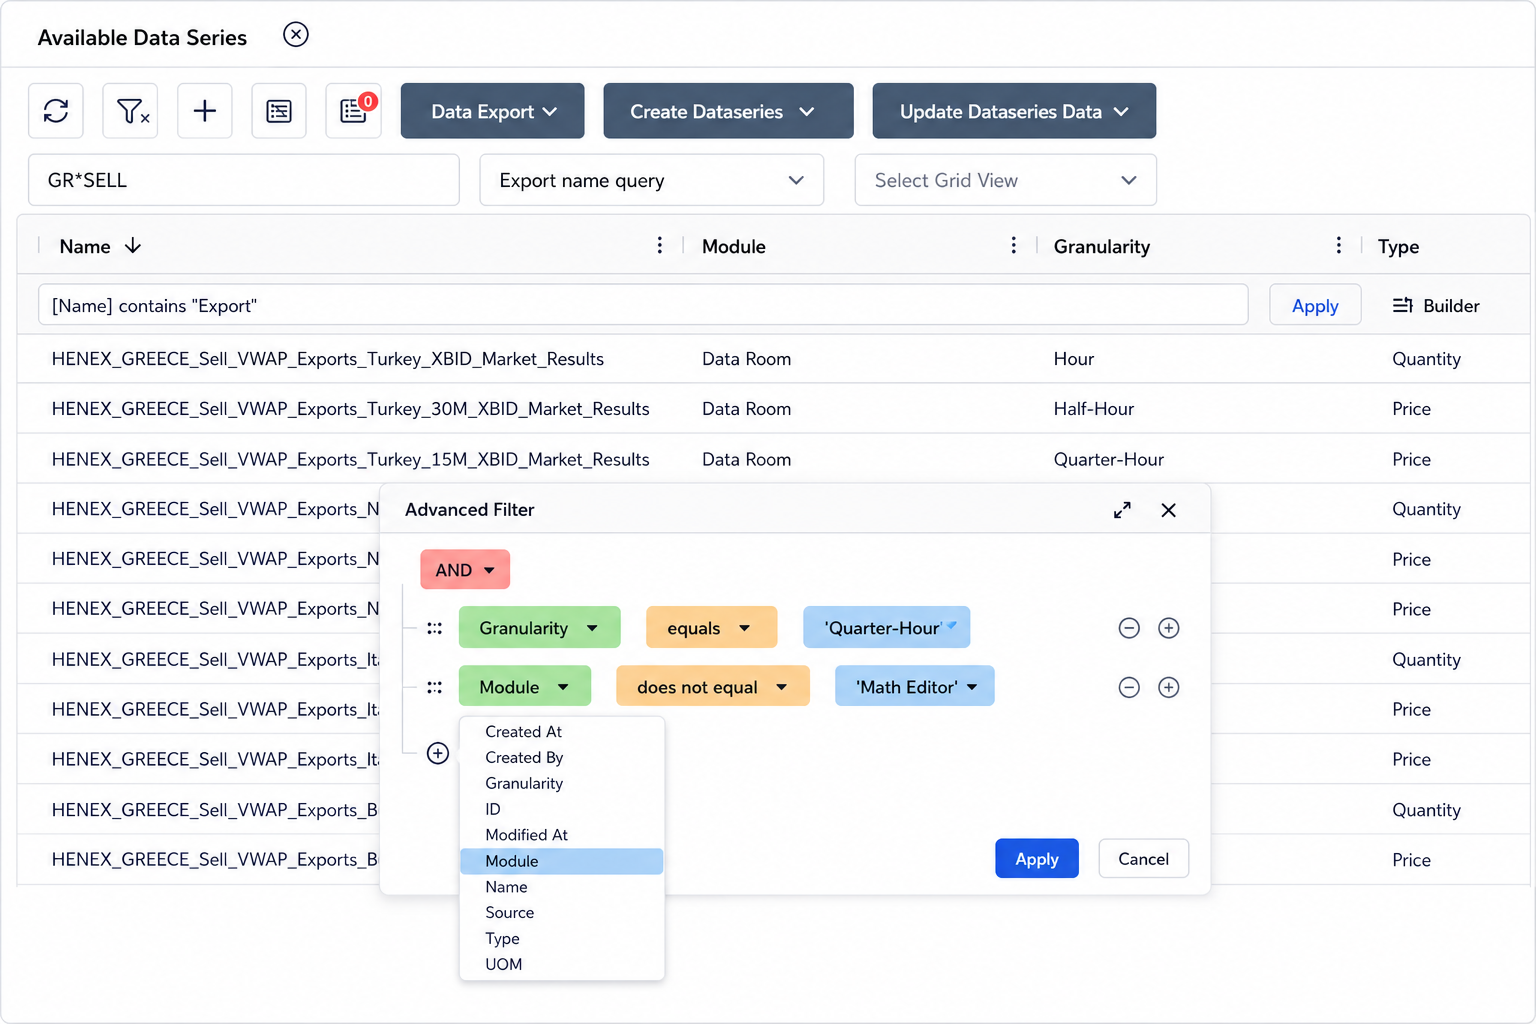
Search by Name
The Search by Name field allows users to search directly within data series names and supports the asterisk (*) as a wildcard. For example, entering DAM*GR returns names containing both DAM and GR, even when other text appears between them.
When a grid query is active, the name search is applied to the filtered results, allowing users to narrow them further. Filtering is performed server-side to support efficient searches across large numbers of data series.
Tags
Tags classify data series based on shared characteristics and can be used as filtering criteria in grid queries. They also provide an easier way to group related data series and organise them into collections.
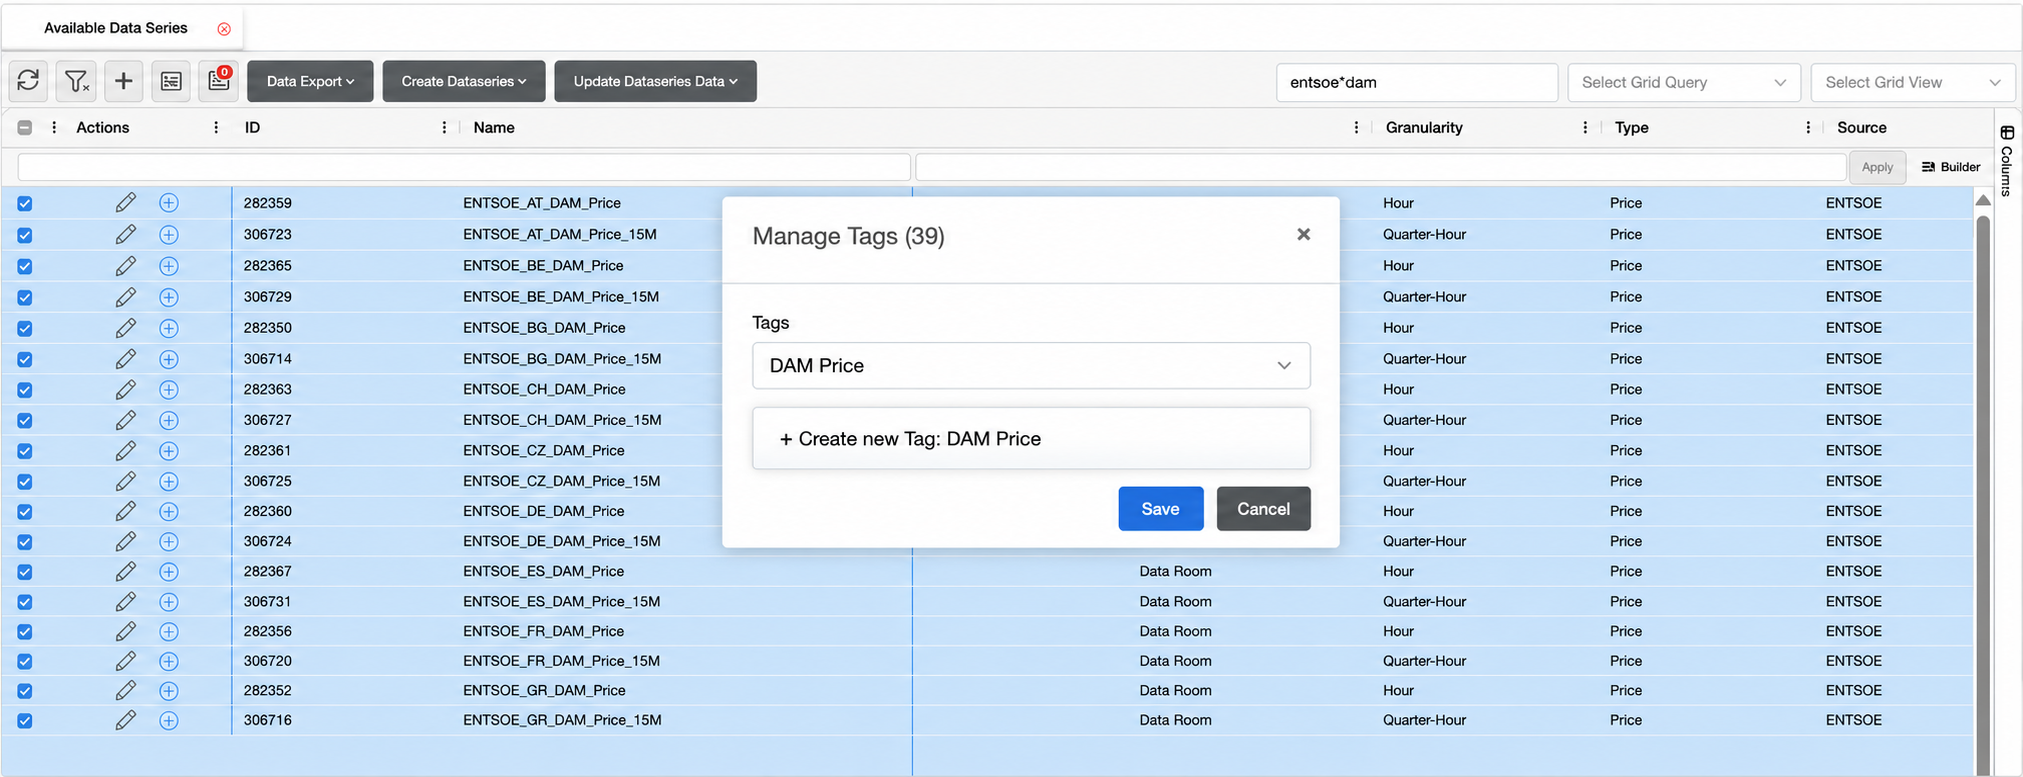
To assign tags, select one or more data series, right-click, and select Manage Tag. The drop-down lists the tags already available in Administration → Tags. If the required tag is not listed, enter its name and select Create new Tag to create and assign it directly.
To remove all tags from the selected series, right-click and select Unassign Tag. Tags can also be managed for an individual series by opening it and selecting Edit from the Info panel.
Example Workflow - Organising DAM Price Series
Tags can be used to establish reusable classifications for data series that may need to be retrieved and combined in different contexts.
Enter ENTSOE*DAM in Search by Name to locate the available ENTSO-E Day-Ahead Market price series. Select the returned timeseries, right-click, and choose Manage Tags. Write DAM Prices and select Create new Tag to create and assign the tag to all selected series.
The DAM Prices tag can later be used in a grid query, either independently or together with other criteria. For example, [Tags] contains "DAM Prices" retrieves all tagged DAM price series, while an additional condition such as Granularity equals "Quarter-Hour" narrows the results to 15-minute series.
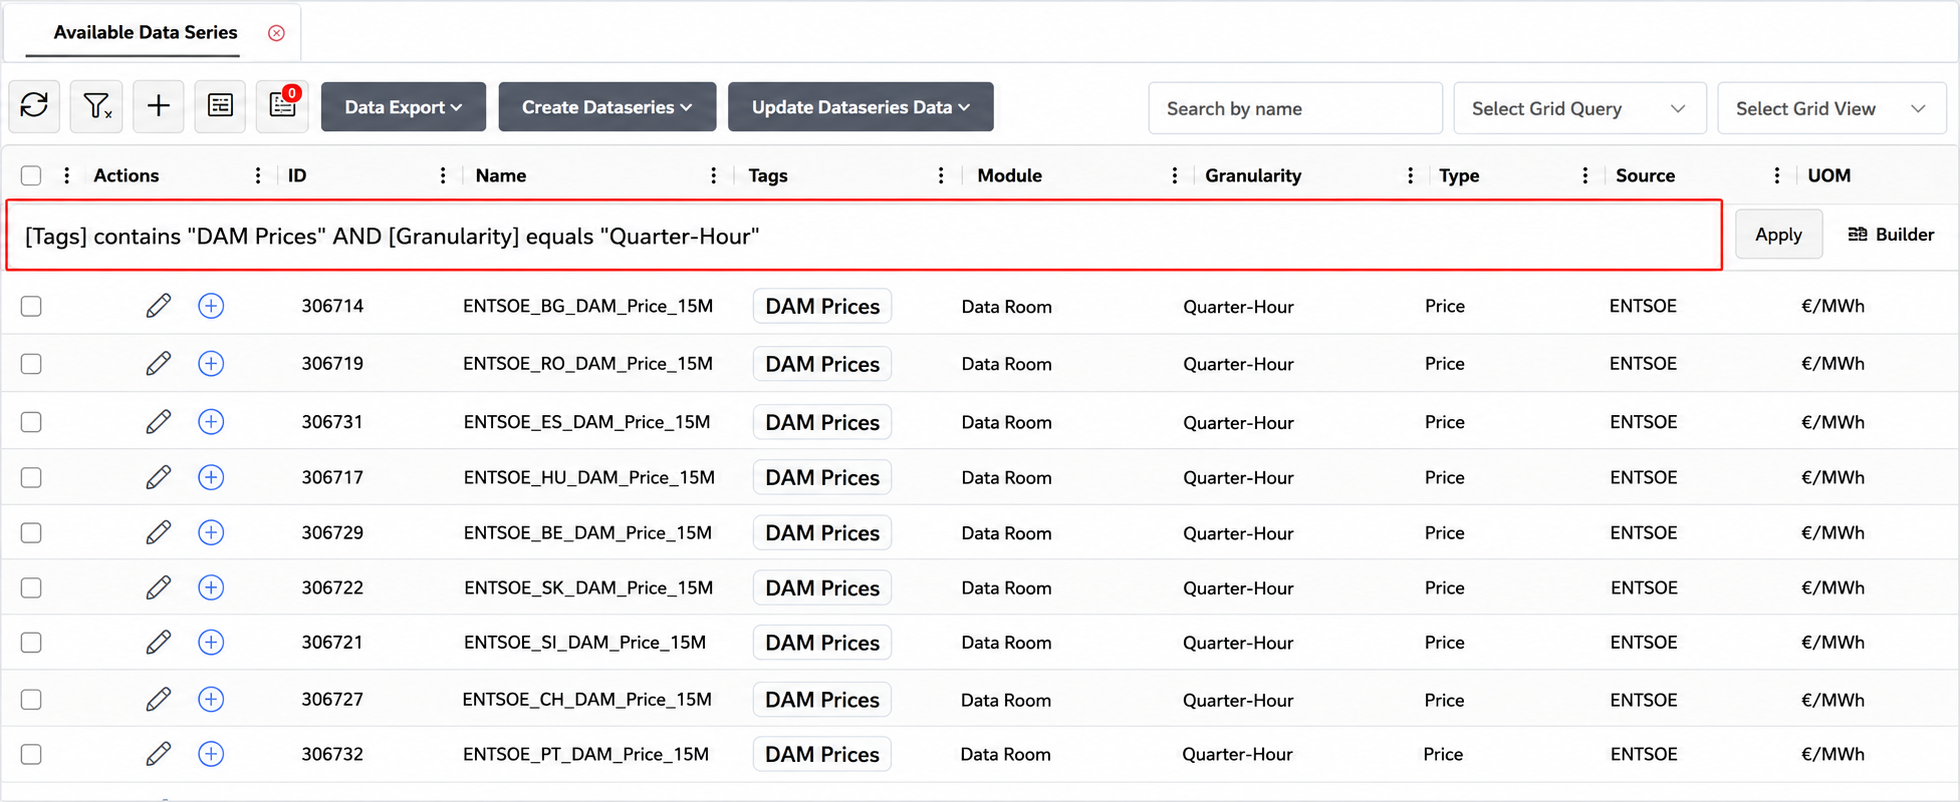
The filtered series can then be selected and added to a collection for a specific analysis or reporting purpose.
As new series are assigned the same tag, they also become available through the saved query without changing the original search logic.
Creating a Data Series
To create a data series, select Add (+) from the Available Data Series toolbar. In the pop-up window, enter the required metadata, including the series name, granularity, type, and UOM. Where applicable, define the upsampling and downsampling methods.
Once the data series is created, its values can be entered or pasted through the Table view.
For creating multiple series or loading values in bulk, use the available templates described under Mass Actions.
Viewing, Editing and Deleting a Data Series
Viewing a Data Series
Double-clicking a row in the grid opens the Data Series page.
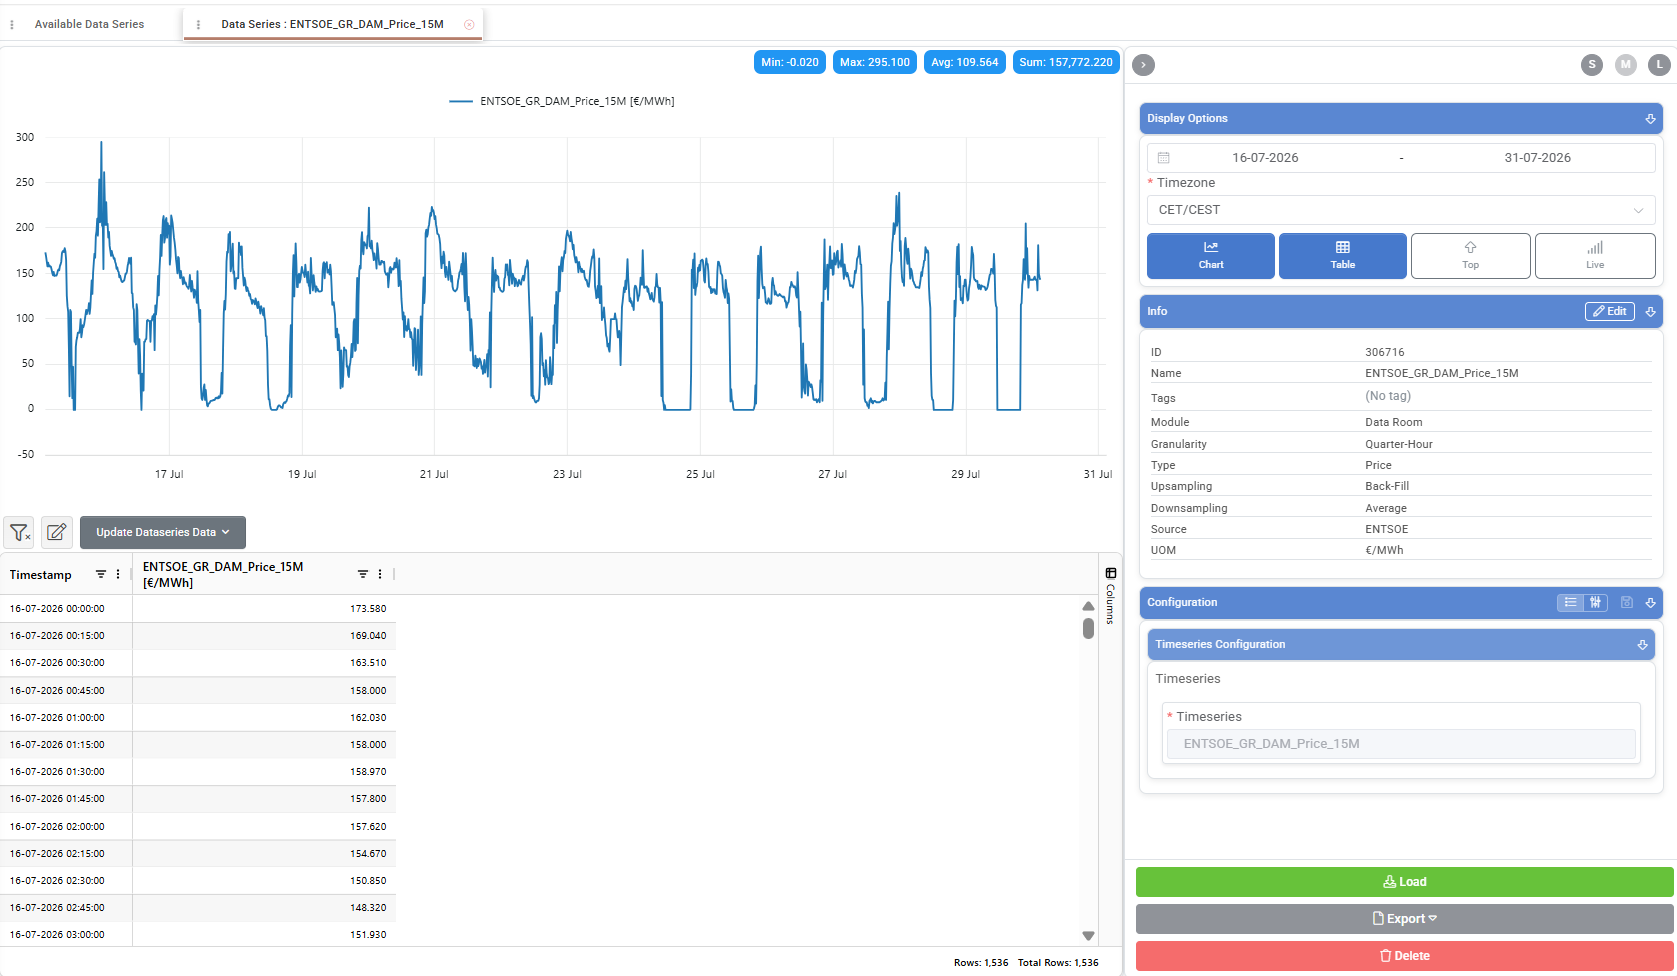
The Display Options panel allows users to define the displayed date range and timezone and control the page layout. The Chart and Table are open by default but can be closed, reopened, or rearranged using Top. Live mode displays incoming values in real time.
The Info panel displays the series metadata, while Configuration provides basic and advanced chart settings.
For detailed description of the fields, see Timeseries Display Options, Chart Configuration and Timeseries Configuration.
Summary statistics, including the minimum, maximum, average, and sum, are displayed above the chart. When cells are selected in the Table, statistics calculated specifically for the selected values appear in the bottom-right corner of the grid.
The Export button at the bottom-right of the page allows users to download the displayed data.
Editing a Data Series
Metadata can be updated through the relevant edit action in the Info panel. In the pop-up window, users can modify fields such as the series name, tags, type, UOM, upsampling and downsampling methods.
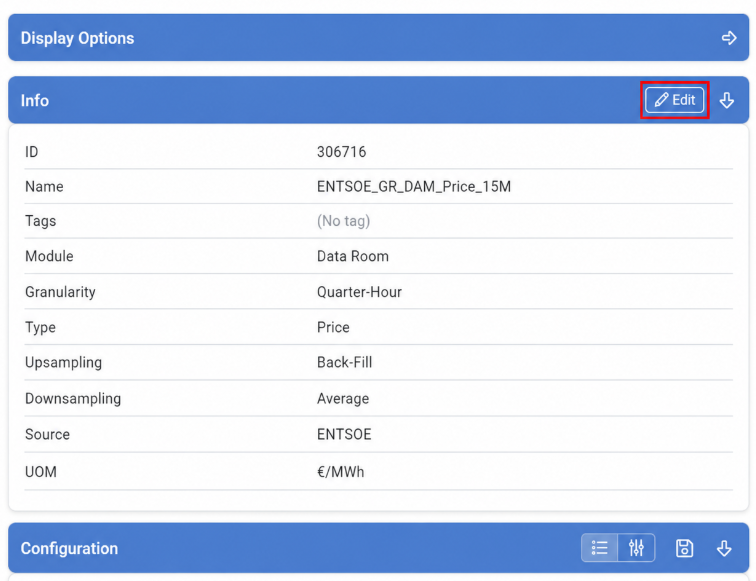
Note: Granularity cannot be changed once a data series has been created. If a different granularity is needed, create a new series.
To edit values, open the series in Table view and select Edit. This adds a New Values column, where users can enter or paste the updated values.
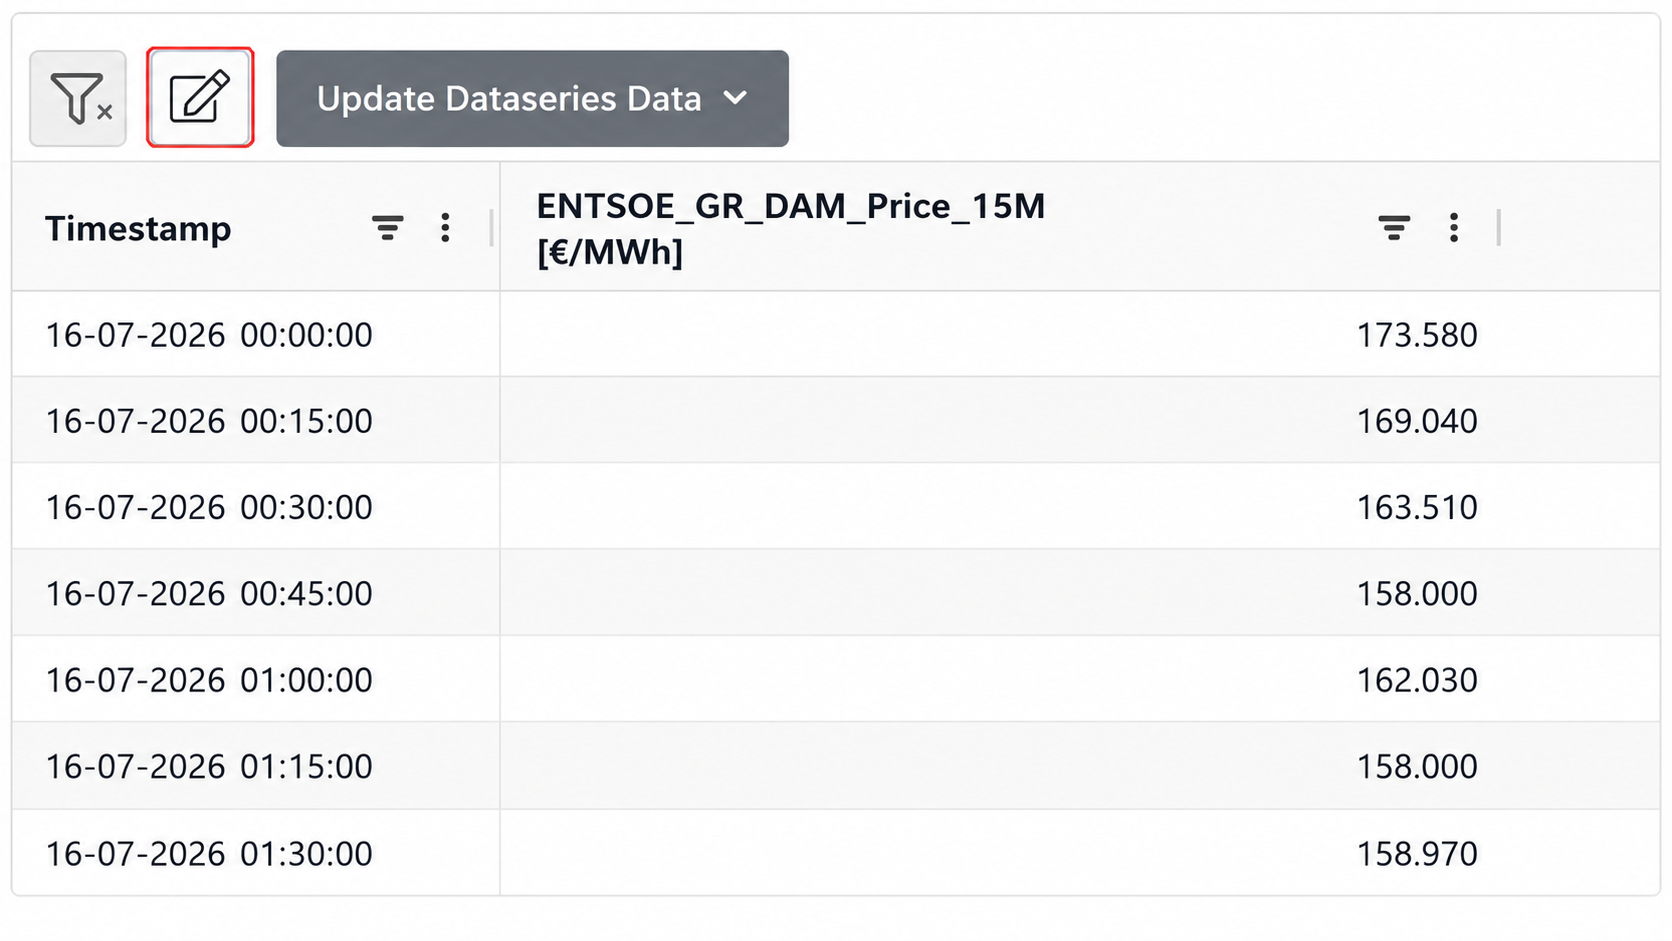
Always click Save after making changes. Navigating away without saving will discard all edits.
For larger updates or multiple series, values can also be loaded through a template (Update Dataseries Data menu). For more information, see Mass Actions below.
Deleting a Data Series
A data series may be deleted either from the grid or from the series info page.
From the grid, right-click the desired row and select Delete Dataseries. Multiple series can be deleted at once by first selecting them using the checkboxes.
Alternatively, open the series and click the Delete button in the right-hand panel.
Mass Actions
Creating Data Series Entries via Template
This process may be used to create one or more new data series and define their structure in a single upload.
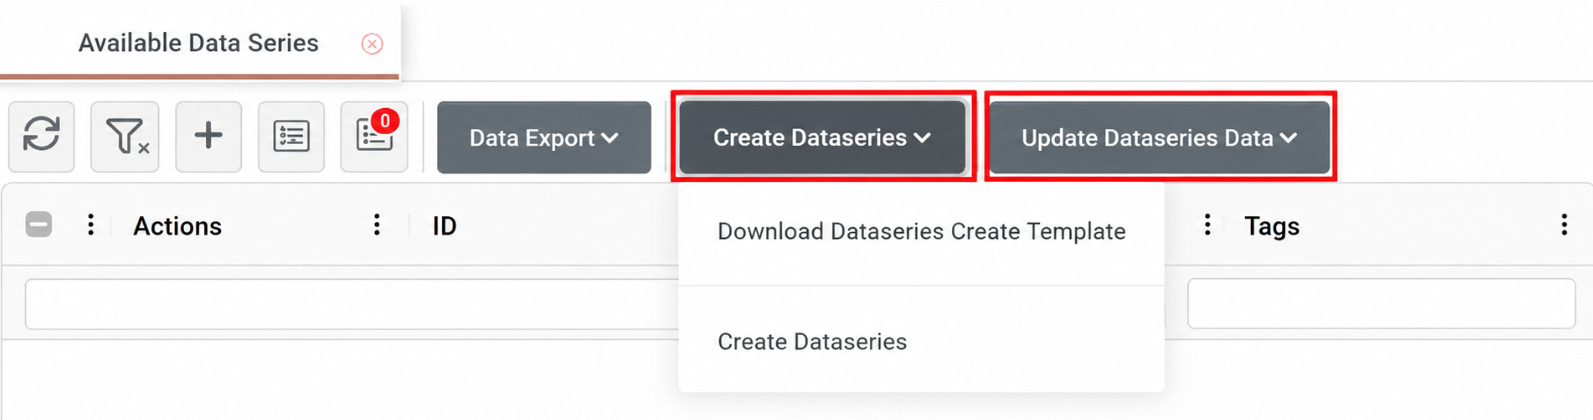
In the Available Data Series grid, click Create Dataseries → Download Dataseries Create Template. An Excel file is downloaded to your computer.
Open the template in Excel. Each row defines one data series. Fill in the required columns: Name, Module, Upsampling & Downsampling Method, Source, Granularity, Type and UOM.
Save the completed file.
Return to the grid and click Create Dataseries → Create Dataseries. Select the completed file in the upload dialog and confirm.
The new data series appear in the grid. They are created with their metadata but contain no data values yet. To populate them with data, proceed to Loading and Updating Data Values via Template below.
Loading and Updating Data Values via Template
This process may be used to enter or update data values across one or more existing data series for a specific date range.
In the Available Data Series grid, select one or more data series using the checkboxes on the left.
Click Update Dataseries Data → Download Data Update Template.
A dialog appears where you set the target date range and time zone for the update.
Click Submit. An Excel file pre-populated with the selected series and date range is downloaded to your computer.
Open the file in Excel and populate the value columns with the new data. Copy-paste from existing spreadsheets is supported.
Save the completed file.
Return to the grid and click Update Dataseries Data → Update Data. Select the completed file and confirm the upload.
Open any of the updated series and navigate to the Data tab to verify the new values have been applied correctly.
Appendix — Field Details
Field / Element | Required | Description |
ID | No | System-assigned numeric identifier for the data series. |
Name | Yes | Descriptive label for the series. System-generated names follow the pattern {Provider}_{Tag1}…{TagN}_{Dataset}. |
Tags | No | User-defined labels created in Administration and assigned to data series for classification and grid filtering. Multiple tags can be assigned to a series. |
Module | Yes | The module that owns the series. |
Granularity | Yes | Time resolution of the series. For possible values, see Data Options. Cannot be changed after creation. |
Type | Yes | Timeseries data type. Possible values: Quantity, Price, Value (see Data Options). |
Source | Yes | Originating source of the data. Possible values: Math Editor, Atlas ETRM Modules, External Providers. |
UOM | Yes | Unit of measurement (e.g. %, €, $, MW, MWh, €/MWh). Selected from the predefined UOM list. |
Upsampling | No | Method used when converting data to a finer granularity. For the available methods, see Data Options. |
Downsampling | No | Method used when converting data to a coarser granularity. For the available methods, see Data Options. |
Was this helpful?