Overview
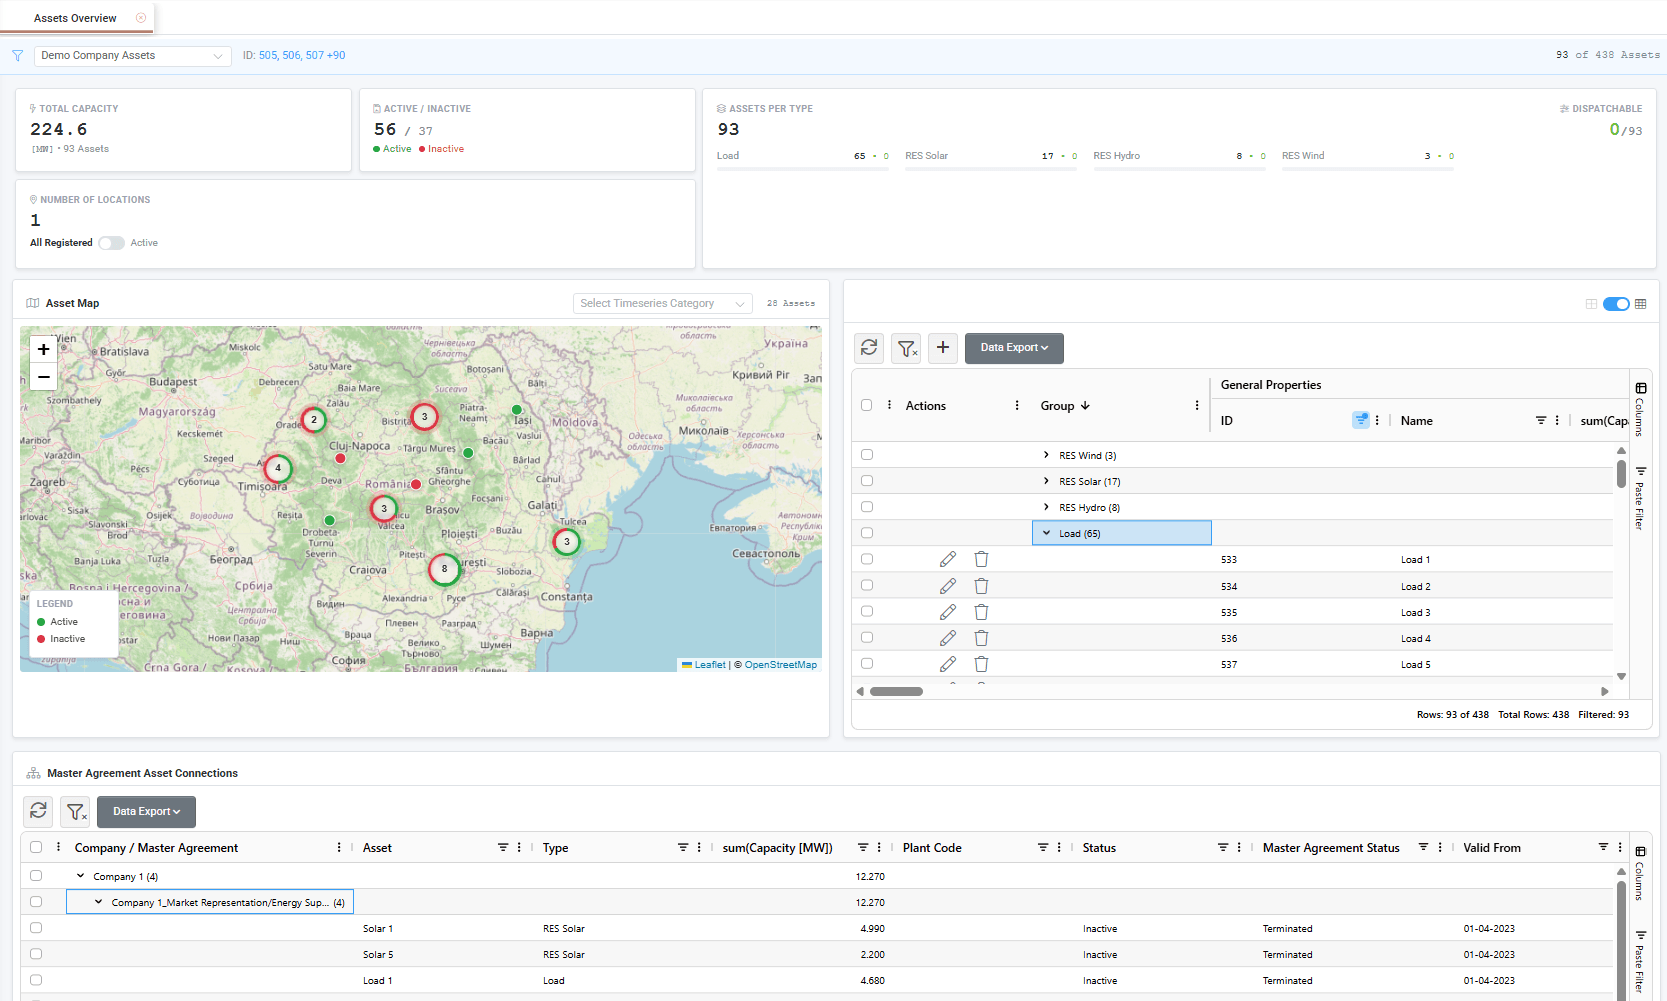
The Assets Overview gives users a single view of their asset portfolio. It brings together key figures about the registered assets, their geographical distribution, and their contractual status, so users can quickly understand what they manage and which assets are currently covered by valid Master Agreements.
The screen consists of four areas: summary metrics at the top, the Asset Map, the asset list next to the map, and the Master Agreement Asset Connections grid at the bottom. All areas are linked, so selecting or filtering assets in one area is reflected in the others.
Filtering the Overview
By default, the Assets Overview displays all registered assets. Users can narrow the displayed assets by selecting one of their saved Assets grid views from the Select View dropdown at the top of the screen. The applied filters are summarized next to the dropdown, while the counter on the right shows how many of the total assets are currently displayed.
When a view is applied, the summary metrics, the map, the asset list and the Master Agreement Asset Connections grid are all updated to reflect only the filtered assets. Filters applied directly on the asset grid have the same effect.
Summary Metrics
The top area summarizes the displayed assets through a set of metric cards: total capacity, active and inactive assets, number of locations, assets per type, and dispatchable assets. An asset is considered active when at least one of its Master Agreement connections is valid on the current date.
The Number of Locations card includes a toggle that switches between counting the locations of all registered assets and only those of active assets.
For the definition of each metric, see the Appendix - Field Details section.
Asset Map
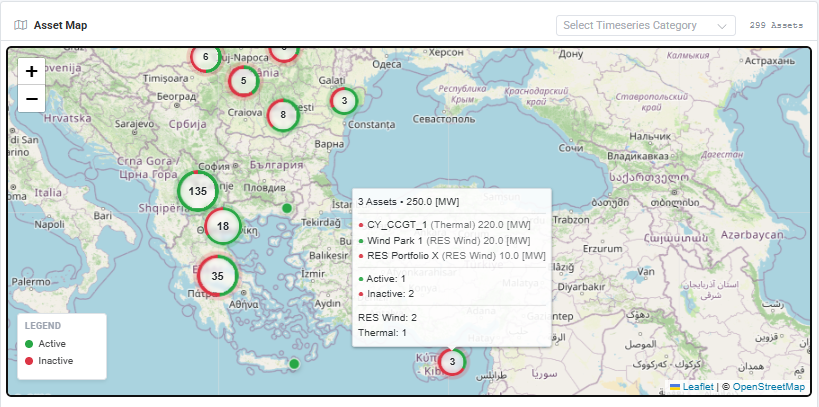
The Asset Map displays all assets with registered coordinates. When zoomed out, nearby assets are grouped into clusters that show the total number of assets in the area, with a colored ring indicating the share of active and inactive assets. As users zoom in, clusters split until individual assets become visible. A legend in the corner of the map explains the colors used.
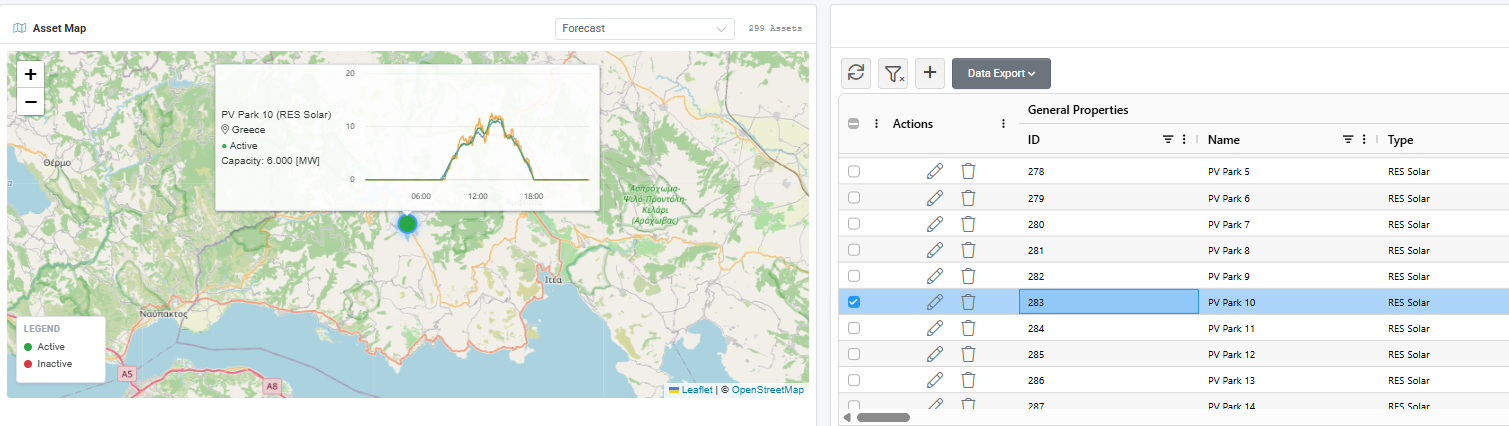
Hovering over a cluster or an asset displays a tooltip with its main information. Clicking an asset highlights it in the asset list, while double-clicking opens the asset record in a new tab.
Users can also select a timeseries category from the Select Timeseries Category dropdown. When a category is selected, the asset tooltip includes a chart of the current day’s values for the asset’s timeseries in that category, offering a quick view of operational data directly from the map.
Asset List
The asset list next to the map can be displayed in two formats, using the toggle at the top right of the area:
Grid – Displays the Assets grid, with the same functionality as the Assets sub-tab, including creating assets, mass actions, views and Data Export. Clicking a row highlights the corresponding asset on the map.
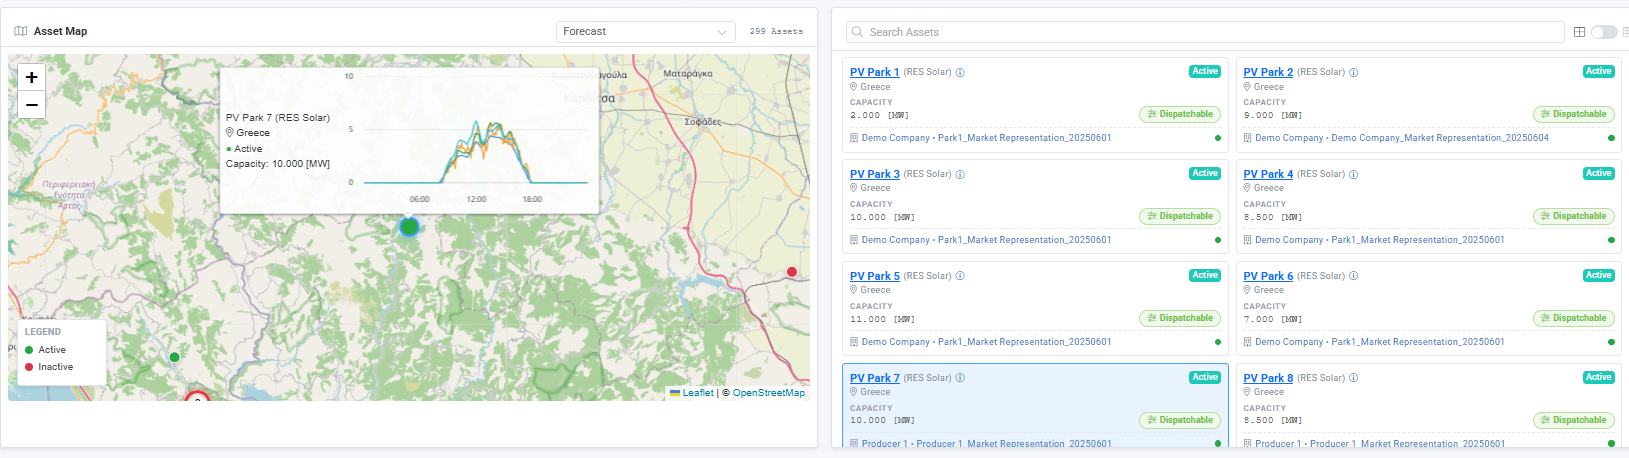
Cards – Displays each asset as a card summarizing its capacity, status, dispatchability and Master Agreement connections. A search field at the top allows users to quickly find assets by name, location, type or plant code. Clicking the asset name opens the asset record, while clicking a connection opens the related Master Agreement.
Master Agreement Asset Connections
The bottom grid lists the connections between the displayed assets and Master Agreements, grouped per Company and Master Agreement. Each group shows the number of connected assets and their total capacity, while the individual rows show the connection details and status.

Double-clicking a connection opens the related asset record. The grid information may be exported to Excel or CSV format using the Data Export option.
Appendix - Field Details
Summary Metrics
Metric | Description |
|---|---|
Total Capacity | Sum of the capacity [MW] of the displayed assets, together with the number of assets included. Capacity is taken from the asset’s Technoeconomic tab. |
Active / Inactive | Number of active assets compared to inactive assets. See Asset Status below. |
Number of Locations | Number of distinct asset locations. Assets are grouped by their Location field or, where no location is defined, by their coordinates. The toggle switches between All Registered assets and Active assets only. |
Assets per Type | Total number of displayed assets, broken down by asset type. For each type, the first number shows the number of assets and the second the number of dispatchable assets, with a bar showing their ratio. |
Dispatchable | Number of dispatchable assets compared to the total number of displayed assets. An asset is dispatchable when Is Dispatchable is enabled in its latest Technoeconomic record. |
Asset Status
Status | Description |
|---|---|
Active | At least one of the asset’s Master Agreement connections is valid on the current date, based on the connection’s Valid From and Valid To dates. |
Inactive | The asset has no Master Agreement connection valid on the current date. |
Asset Map Tooltips
Element | Description |
|---|---|
Cluster tooltip | Number of assets per status, total capacity [MW], and number of assets per type within the cluster. |
Asset tooltip | Asset name and type, location, status and capacity [MW]. When a timeseries category is selected, it also includes a chart of the current day’s values for the asset’s timeseries in that category. |
Asset Cards
Element | Description |
|---|---|
Name (Type) | Name of the asset, followed by its type. Clicking the name opens the asset record. |
Info icon | Displays the asset’s Installed Capacity, Licensed Capacity, Plant Code, Longitude and Latitude. |
Location | Location of the asset. |
Capacity | Capacity of the asset [MW]. |
Status badge | Active or Inactive. See Asset Status above. |
Dispatchability badge | Dispatchable or Non-Dispatchable. |
Connections | Company and Master Agreement of each connection, with a dot indicating whether the connection is active (green) or inactive (red). Clicking a connection opens the Master Agreement. |
Master Agreement Asset Connections Grid
Column | Description |
|---|---|
Company / Master Agreement | Grouping of the connections per Company and Master Agreement, with the number of connected assets in brackets. |
Asset | Name of the connected asset. |
Type | Type of the connected asset. |
Capacity [MW] | Capacity of the connected asset. Group rows show the total capacity. |
Plant Code | Plant code of the connected asset. |
Status | Active when the connection is valid on the current date, otherwise Inactive. |
Master Agreement Status | Status of the related Master Agreement (e.g. Terminated). |
Valid From | Start date of the connection. |
Valid To | End date of the connection. |