Overview
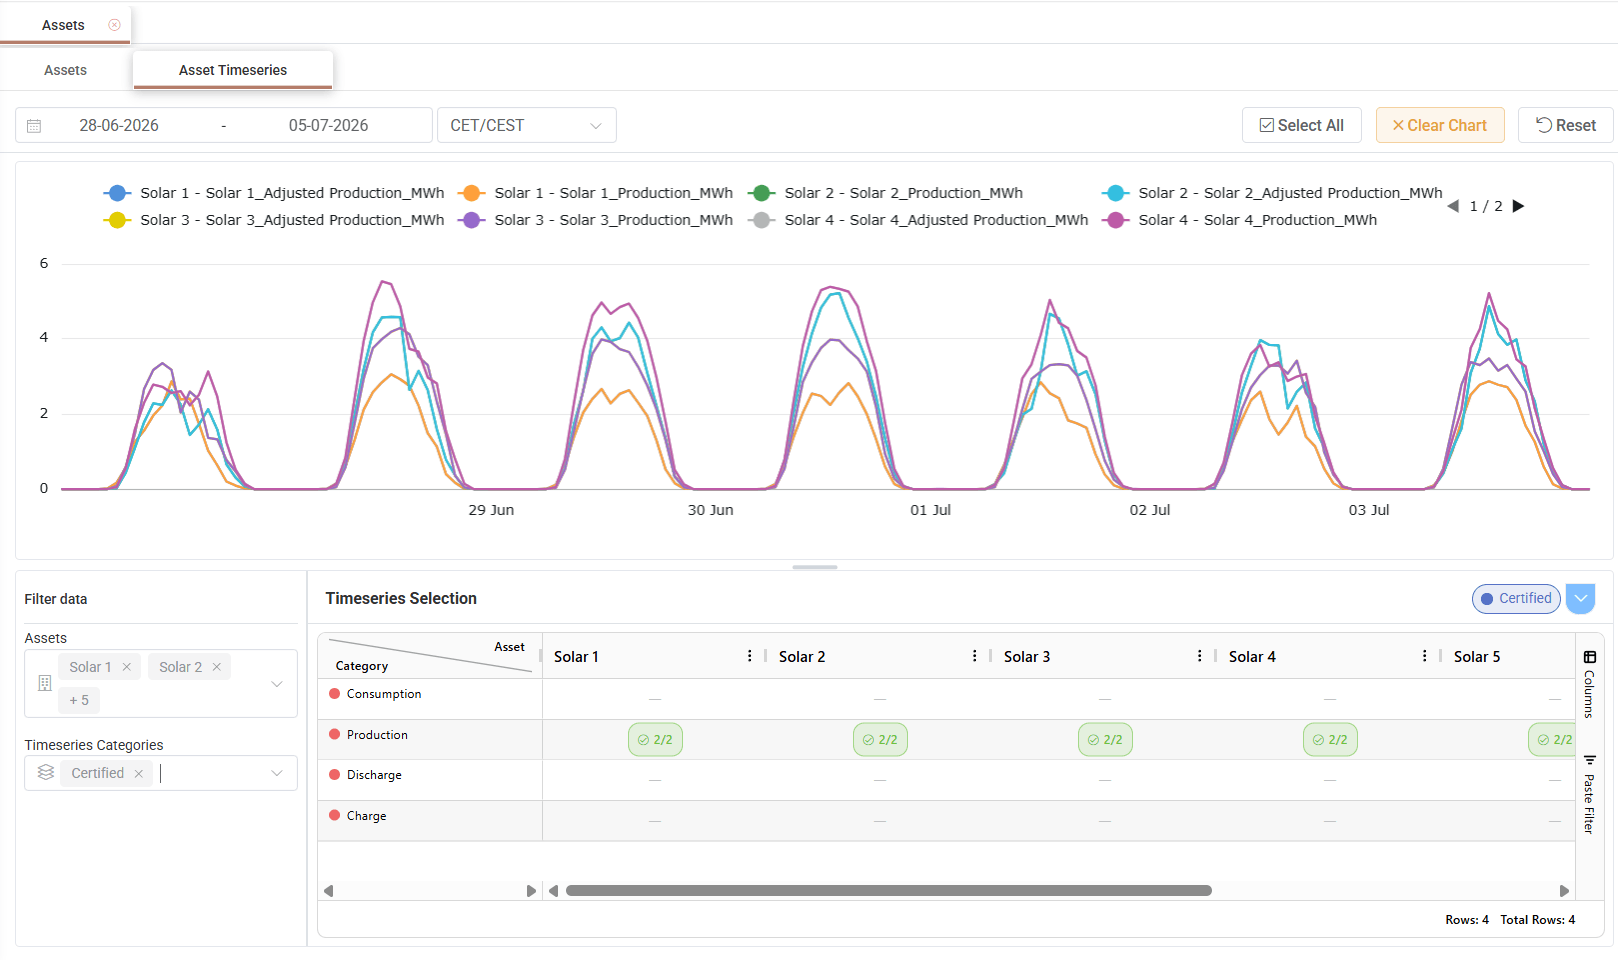
The Asset Timeseries sub-tab allows users to analyze timeseries data associated with assets. Users can select the required assets, choose one or more timeseries categories, define the time window, and visualize the selected data in chart format. This makes it easy to compare operational data, such as forecasts, measurements or certified production, across several assets at once.
The sub-tab can also be opened from the Assets grid through the View Timeseries mass action, in which case the selected assets are already pre-filled.
Viewing Asset Timeseries
Select the required assets and timeseries categories from the Filter Data area at the bottom left of the screen. The Timeseries Selection grid is then populated with the timeseries available for each selected asset, organized by category.
Tick the timeseries to be displayed. The chart is updated with each selection, showing the values for the defined time window together with summary statistics. Where an asset has more than one timeseries of the same type, the cell lists them so that the required ones can be selected individually.
The Select All option automatically selects all actual timeseries linked to the selected asset(s), excluding categories where no timeseries data is available. The Clear Chart option removes the displayed series from the chart, while Reset clears all selections.
Appendix - Field Details
Field / Element | Description |
Date Range | Time window for which timeseries values are displayed. |
Timezone | Timezone in which the timeseries values are displayed (e.g. CET/CEST). |
Assets | Assets whose timeseries are available for selection. Multiple assets can be selected. |
Timeseries Categories | Categories of timeseries to be made available for selection (e.g. Non-Certified, Certified, Climatic Data, Theoretical, Availability, State of Charge (SoC), Curtailments, Spot Market). Each category is marked with its own colour. |
Timeseries Selection | Grid listing the timeseries types per category in rows and the selected assets in columns. Each cell shows the asset’s timeseries of that type, which can be ticked to be added to the chart. Where more than one timeseries exists, the cell shows how many are selected out of those available (e.g. 0/2). |
Chart | Displays the selected timeseries, labelled by asset and timeseries name. The Min, Max, Avg and Sum of the displayed values are shown above the chart. |
Select All | Selects all actual timeseries linked to the selected asset(s), excluding categories where no timeseries data is available. |
Clear Chart | Removes all displayed series from the chart. |
Reset | Clears the selected assets, categories and timeseries. |